Short answer
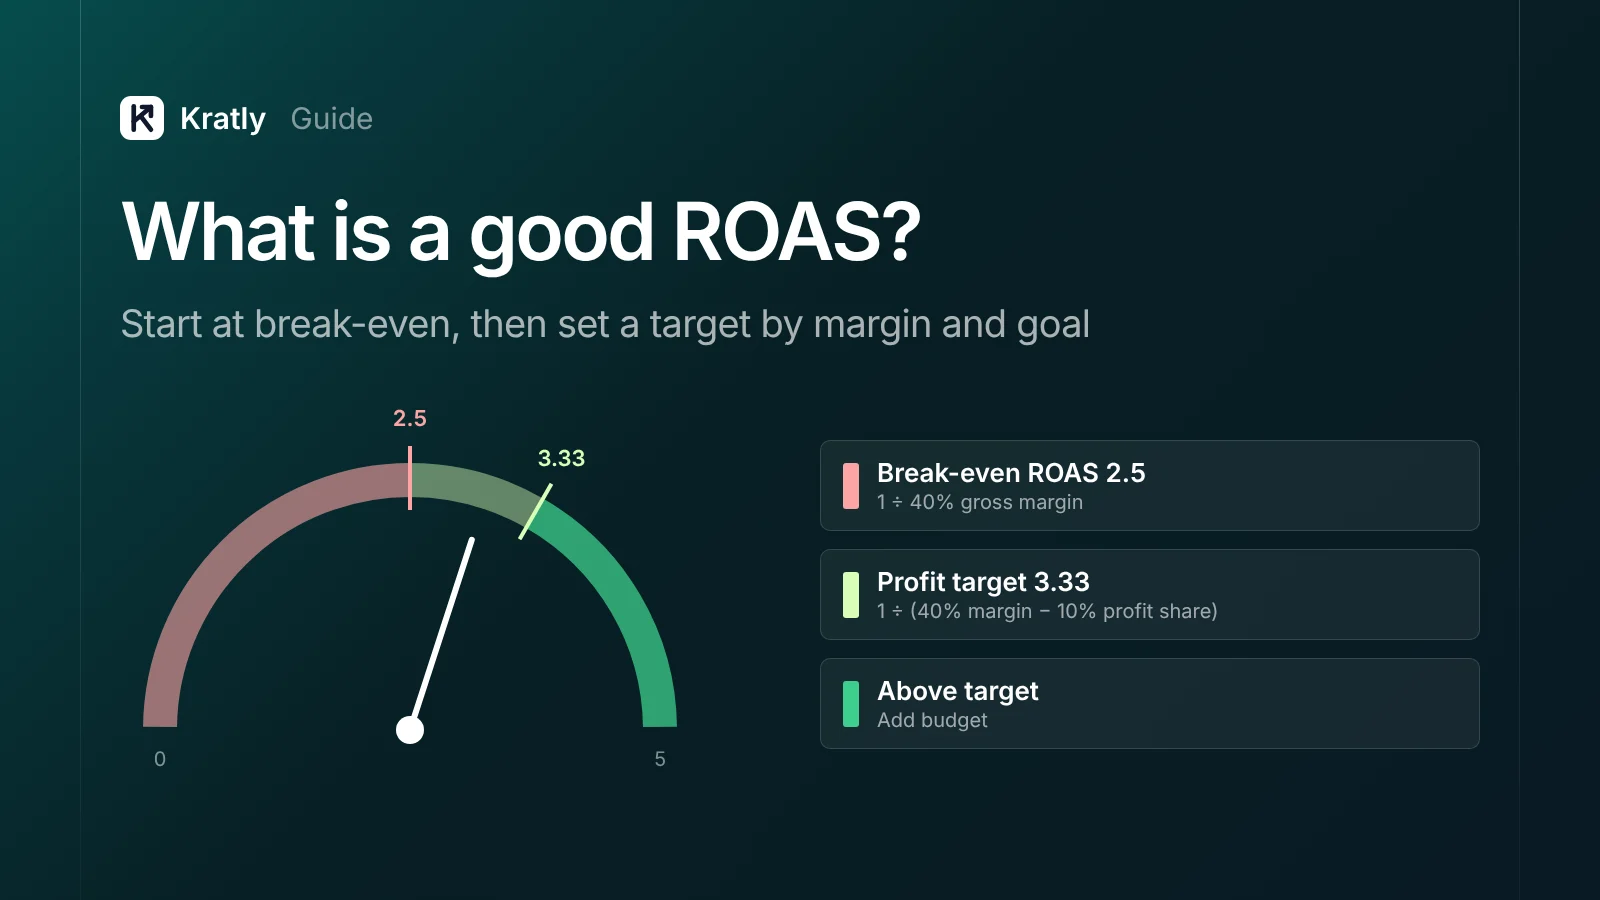
What is a good ROAS? Any return above your break-even, which is 1 divided by your gross margin. At a 40% margin, break-even is 2.5. Aim higher if you need profit now. Go lower only if repeat purchases or subscriptions pay back the rest. Judge it on real revenue, not platform reports.
Composite example: a store owner sees a 4.0 ROAS in Meta Ads Manager. Her margin after product cost, shipping and fees is 30%, so break-even is 3.3. In Shopify, orders her own tracking ties to Meta add up to a 2.6 ROAS. She was losing money on every sale. (Made-up example, not a real company or Kratly customer.)
A good ROAS depends on your margin, your goal and how you measure it. The basic break-even table by margin is in when to pause a Google Ads campaign. This guide goes further.
ROAS vs ROI vs MER vs POAS: what's the difference?#
ROAS (return on ad spend) is the revenue your ads bring in divided by what you spent on them. A ROAS of 3 means $3 of revenue for every $1 of ad spend.
ROAS ignores costs. Three other ratios fill the gaps.
| Metric | Formula | What it answers |
|---|---|---|
| ROAS | Ad-attributed revenue ÷ ad spend | Does this campaign bring revenue? |
| ROI | (Profit − total cost) ÷ total cost | Did the whole effort make money? |
| MER (marketing efficiency ratio) | Total revenue ÷ total marketing spend | Is marketing working overall? |
| POAS (profit on ad spend) | Gross profit from ad-attributed sales ÷ ad spend | Does this campaign make profit? |
ROAS vs ROI: ROAS is a revenue ratio, ROI a profit ratio. A ROAS of 3 can hide a negative ROI if your margin is thin.
MER, sometimes called blended ROAS, uses all revenue, so attribution can't fool it. It also can't tell you which campaign to cut. POAS takes the margin out first, so break-even POAS is always 1.0.
A worked example (illustrative numbers)#
These numbers are made up to show the math. They are not from a real company.
A store spends $40,000 in a month on Google Ads and Meta. It also pays a $5,000 agency fee. Its margin after product cost, shipping, payment fees and refunds is 40%.
| Measure | Inputs | Result |
|---|---|---|
| Platform ROAS | Google reports $90,000, Meta reports $80,000 ÷ $40,000 | 4.25 |
| ROAS from own tracking | $120,000 of Shopify orders tied to ads, each order counted once ÷ $40,000 | 3.0 |
| MER | $240,000 total Shopify revenue ÷ $45,000 total marketing cost | 5.3 |
| POAS | $120,000 × 40% = $48,000 gross profit ÷ $40,000 | 1.2 |
| ROI on paid | ($48,000 − $45,000) ÷ $45,000 | 6.7% |
Break-even ROAS at 40% margin is 2.5, so 3.0 clears it, and POAS of 1.2 says the same. But after the agency fee, paid ads made only $3,000. The platforms also claimed $50,000 more revenue than the store's own tracking found.
Why "4:1 is a good ROAS" misleads#
Rules like "aim for 4:1" get repeated in forums and agency decks. They fail for four reasons.
- Margin. At 20% margin, 4:1 loses money. At 80%, 4:1 is very profitable and you're likely underspending.
- Different revenue. A 4:1 in Meta, in Google and in Shopify measure different things.
- Goals. A brand buying repeat customers can run below break-even on the first order. A store short of cash can't.
- Scale. A ROAS of 8 on $500 a month may be worth less than 3 on $20,000.
How do you set a target ROAS by margin and goal?#
Start from break-even: 1 ÷ gross margin (Amazon Ads). Then adjust for your goal.
- Profit goal: target ROAS = 1 ÷ (margin − profit share you want). A 10% share at 40% margin gives 1 ÷ 0.30 = 3.33.
- Growth goal: target ROAS = 1 ÷ (margin × revenue multiple over your payback window). If a buyer spends twice their first order within 12 months, the multiple is 2.
| Gross margin | Profit goal (keep 10% of revenue) | Growth goal (2× first order in 12 months) |
|---|---|---|
| 30% | 5.0 | 1.67 |
| 40% | 3.33 | 1.25 |
| 50% | 2.5 | 1.0 |
| 60% | 2.0 | 0.83 |
These are illustrative targets from the formulas, not benchmarks. The growth column holds only if repeat revenue really shows up in your cohorts.
I'd run accounts with two numbers: a floor (break-even) and a goal. Above the goal, add budget. Between the two, fix. Below the floor after enough data, cut. For budget size, see how much to spend on Google Ads.
First-order vs lifetime ROAS for subscriptions and repeat buyers#
First-order ROAS counts only the first payment. Lifetime ROAS counts all revenue the customer brings over a set window, often 6 or 12 months.
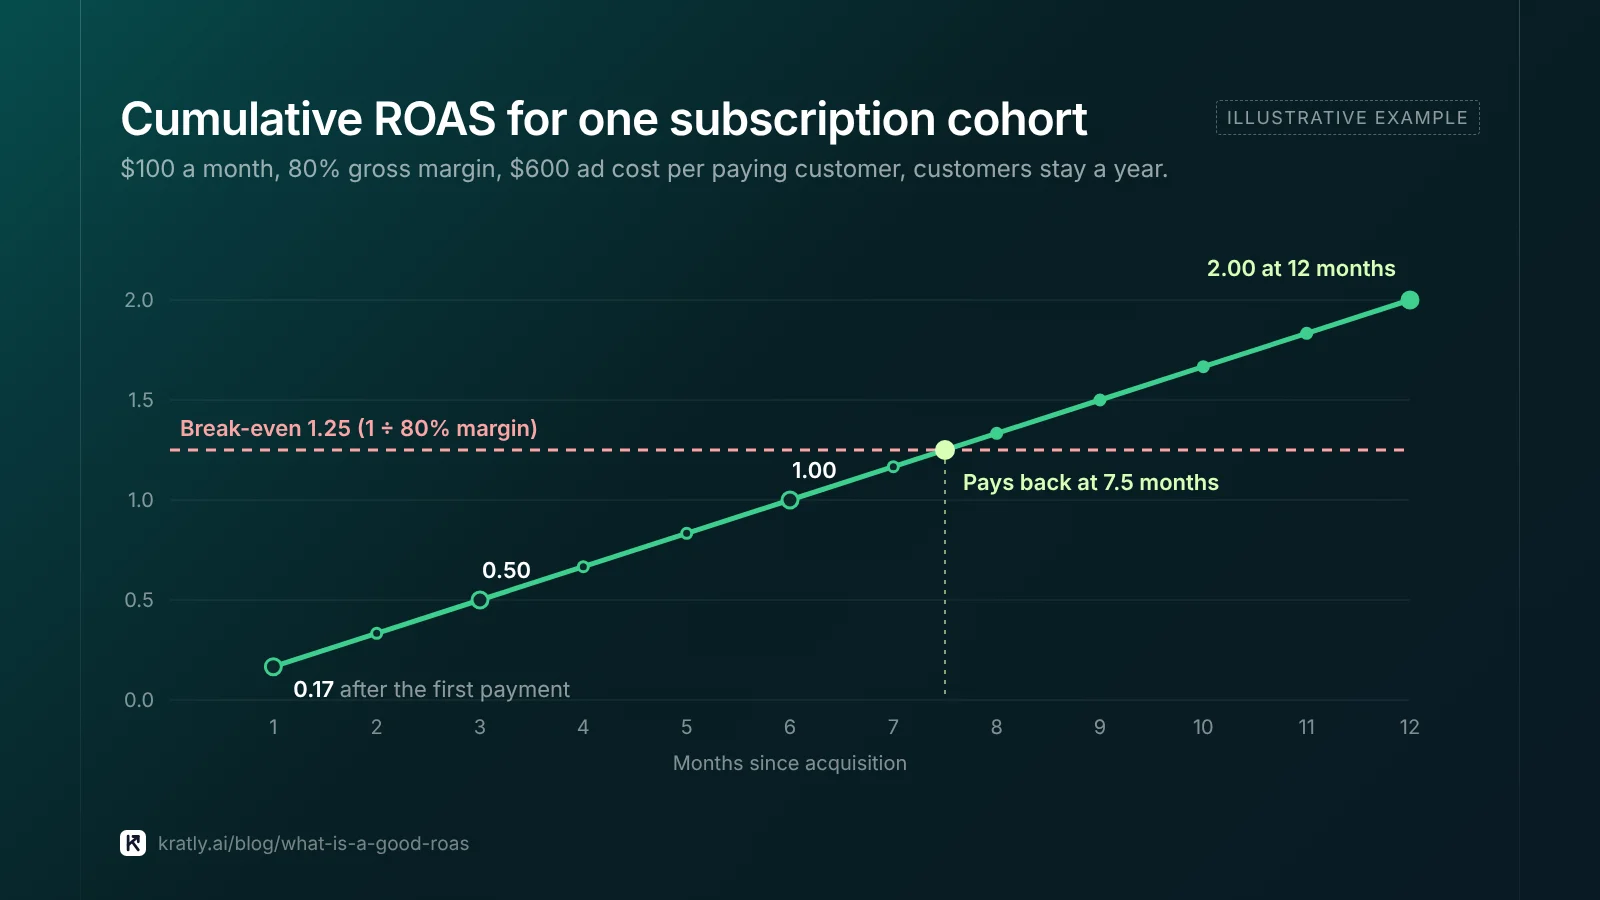
For SaaS, first-order ROAS is nearly useless. Take an illustrative $100-a-month product with 80% gross margin and $600 ad cost per paying customer. First-month ROAS is 0.17. If customers stay a year, 12-month ROAS is 2.0, and payback on gross profit is 7.5 months.
So measure ROAS on Stripe payments by acquisition month, at 1, 3, 6 and 12 months. Judge campaigns on cost per paying customer; CAC by channel shows how to count the cost side.
Repeat-purchase stores, like a coffee brand, often earn back acquisition on the second or third order. Use 90- or 180-day ROAS there. Keep first-order ROAS for one-off products.
Platform-reported vs incremental ROAS#
Platform ROAS counts every sale the platform can claim. Incremental ROAS counts only sales that would not have happened without the ads. It's lower, sometimes by a lot.
The best-known proof is eBay's. When eBay paused brand search ads, 99.5% of the lost paid clicks came back through organic search. For non-brand search, researchers estimated a return of −63% (NBER, Blake, Nosko and Tadelis).
Brand searches inflate platform ROAS (test your brand bidding). So do view-through credit and overlap between platforms. One Meta ads educator lists current defaults as 7-day click, 1-day engage-through and 1-day view (Jon Loomer).
To find incremental ROAS, run a holdout. Google's Conversion Lift has a $5,000 minimum budget (Google Ads Help). Google opened it to Search and Performance Max as self-serve on October 7, 2026 (Search Engine Land). Smaller budgets can use a geo or time holdout, covered in did your marketing change really work? and in incrementality testing on a small budget.
Google Ads ROAS and Meta Ads ROAS settings#
Google Ads ROAS: target ROAS bidding#
Google Ads shows ROAS as Conv. value / cost; target ROAS takes a percentage. Google's example: $5 in sales ÷ $1 in ad spend × 100% = 500% target ROAS (Google Ads Help).
Minimum data, per the same page:
| Campaign type | Conversions needed for target ROAS |
|---|---|
| Search and Shopping | 15 in the past 30 days, at the conversion tracking level |
| Display | 15 with values in the past 30 days, across all campaigns |
| Demand Gen | 50 in the campaign in the past 35 days (10 in the last 7), or 100 across Demand Gen campaigns |
The bigger issue is what you call "value." If it's a sign-up or a guess, target ROAS chases the wrong thing. Send real payment amounts, or gross profit, which turns the target into a POAS target. Fix the leaks in Google Ads wasted spend first.
Meta Ads ROAS: purchase ROAS and minimum ROAS#
Meta reports purchase ROAS as total purchase conversion value divided by total spend. Its minimum ROAS bid strategy sets a floor on that ratio. Meta notes that "setting the benchmark too high may lead to under-delivery" (Meta for Developers).
Value optimization needs enough purchases. Commonly reported thresholds are about 30 purchases with 5+ different values in 14 days (Jon Loomer). For SaaS, the fix is to send real Stripe payment values back to Meta, as in Facebook ads for SaaS.
What do published ROAS benchmarks say?#
Few reliable ROAS benchmarks exist. Two are worth knowing.
- Triple Whale (vendor data, 2024). The median ROAS for brands advertising on its platform was 2.04 (Triple Whale). That covers Triple Whale customers only, measured its way.
- Google's Economic Impact report. Google assumes businesses make $2 in profit for every $1 spent on Google Ads, based on a 2009 paper by Hal Varian (Google Economic Impact). That's an economic estimate, not a ROAS benchmark. Some posts quote it as 2:1 ROAS, which is a different claim.
A median of 2.04 suggests many stores run near break-even. Your margin, not a median, sets your number.
How to do this in Kratly#
A note on bias: Kratly sells software for measuring ad revenue. Everything above works in a spreadsheet too. For what an AI tool should and shouldn't do with your budget, see AI marketing agent: what it can do, what it can't, how to choose.
- Run the free wasted-spend checker. Upload your Google Ads search terms report; it runs in your browser and flags searches that spend without converting.
- Connect Google Ads, Meta, and Stripe or Shopify. Kratly ties each campaign to the payments it brought, counting each sale once.
- Compare each campaign with your break-even. Work out break-even ROAS from your margin as shown above, then check each campaign's revenue per dollar against it.
- Approve suggested changes. You approve each budget move; every change is logged and reversible.
Questions, answered
What is a good ROAS for ecommerce?
A good ROAS for ecommerce clears two lines: a floor at break-even (1 ÷ gross margin after shipping, fees and refunds) and a goal set by what you need. At a 30% margin, the floor is 3.3; keeping 10% of revenue as profit needs 5.0. If buyers reliably reorder, judge 90- or 180-day ROAS instead of the first order.
What is the difference between ROAS and ROI?
ROAS divides ad-attributed revenue by ad spend. ROI divides profit, after all costs, by total cost. ROAS ignores product cost, fees and agency costs. So a campaign can show a ROAS of 3 and still lose money. Use ROAS to compare campaigns and ROI, or POAS, to judge whether they make money.
What is a good ROAS for SaaS?
First-payment ROAS is usually below 1 for SaaS, and that can be fine. Judge SaaS campaigns on cost per paying customer and payback instead. Track ROAS at 3, 6 and 12 months by acquisition cohort, using Stripe payments. A campaign that passes break-even within your payback target is a good one.
Why is my Meta ROAS higher than my Shopify numbers show?
Meta counts sales after clicks and, by default, after views too. It can also claim buyers that Google claims. Shopify counts each order once. So platform ROAS usually runs above what your store sees. Compare both with MER, and run a holdout test to find the incremental ROAS.
Written by
Priyansh Kumar
Priyansh Kumar has spent more than a decade in growth, scaling brands from 1 to 10 and from 10 to 100. He now builds Kratly, an autonomous growth team that ties every campaign, page and email to the revenue it brings.
Sources
- Amazon Ads: Ads math and break-even ROAS
- Google Ads Help: About target ROAS bidding · Conversion Lift
- Meta for Developers: Bid strategy (minimum ROAS)
- NBER: Blake, Nosko and Tadelis, Consumer heterogeneity and paid search effectiveness (w20171)
- Search Engine Land: Google opens Conversion Lift to Search and Performance Max (Oct 2026)
- Jon Loomer: Meta ads attribution 2026 · Value optimization requirements
- Triple Whale: What's a good ROAS? (Apr 2025, vendor data)
- Google: Economic Impact methodology
Was this article useful?