Short answer
Incrementality testing on a small budget means picking the cheapest test your volume can support. Under about $20k a month, use on/off switchbacks or user holdouts. With 20 or more comparable regions, run a geo holdout test with GeoLift. Save marketing mix modeling for when you have two or more years of steady multi-channel spend.
Composite example: a SaaS team spends $30k a month on Meta. Meta says the ads return 3x. The founder asks: would those customers have come anyway? A vendor study is out of budget. A user holdout is too, with only a few hundred trials a month.
Our guide on running a marketing incrementality test covers the basics and a user holdout step by step. This one goes deeper on the methods a small budget can afford.
Which incrementality testing method fits your budget?#
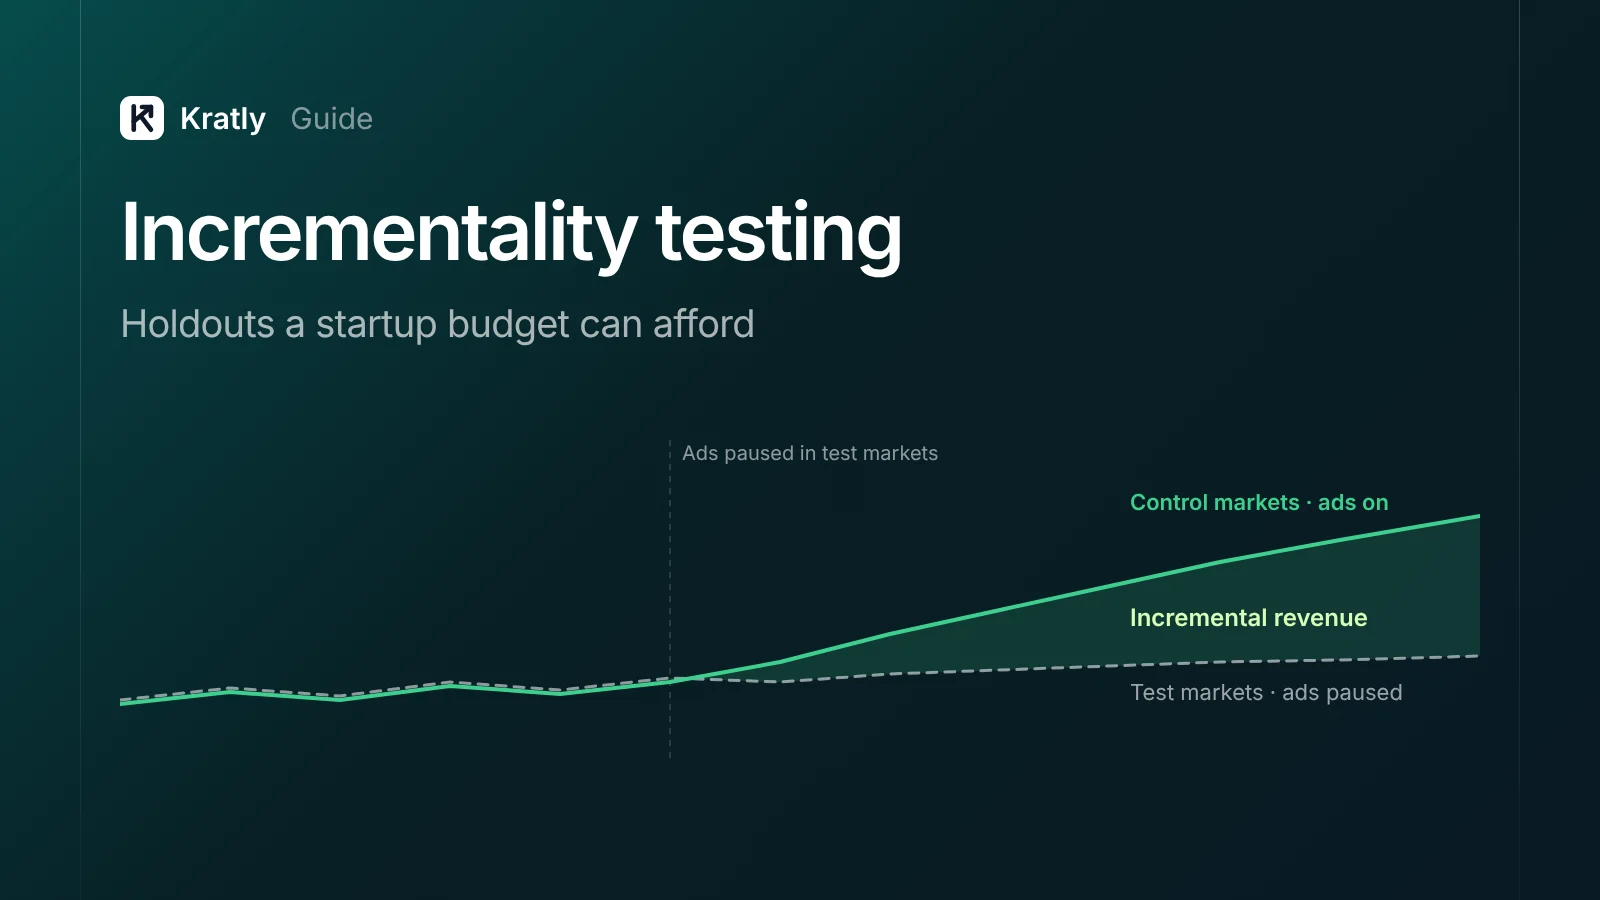
Incrementality testing is the practice of comparing a group that gets your marketing with a similar group that doesn't, to measure what the marketing caused.
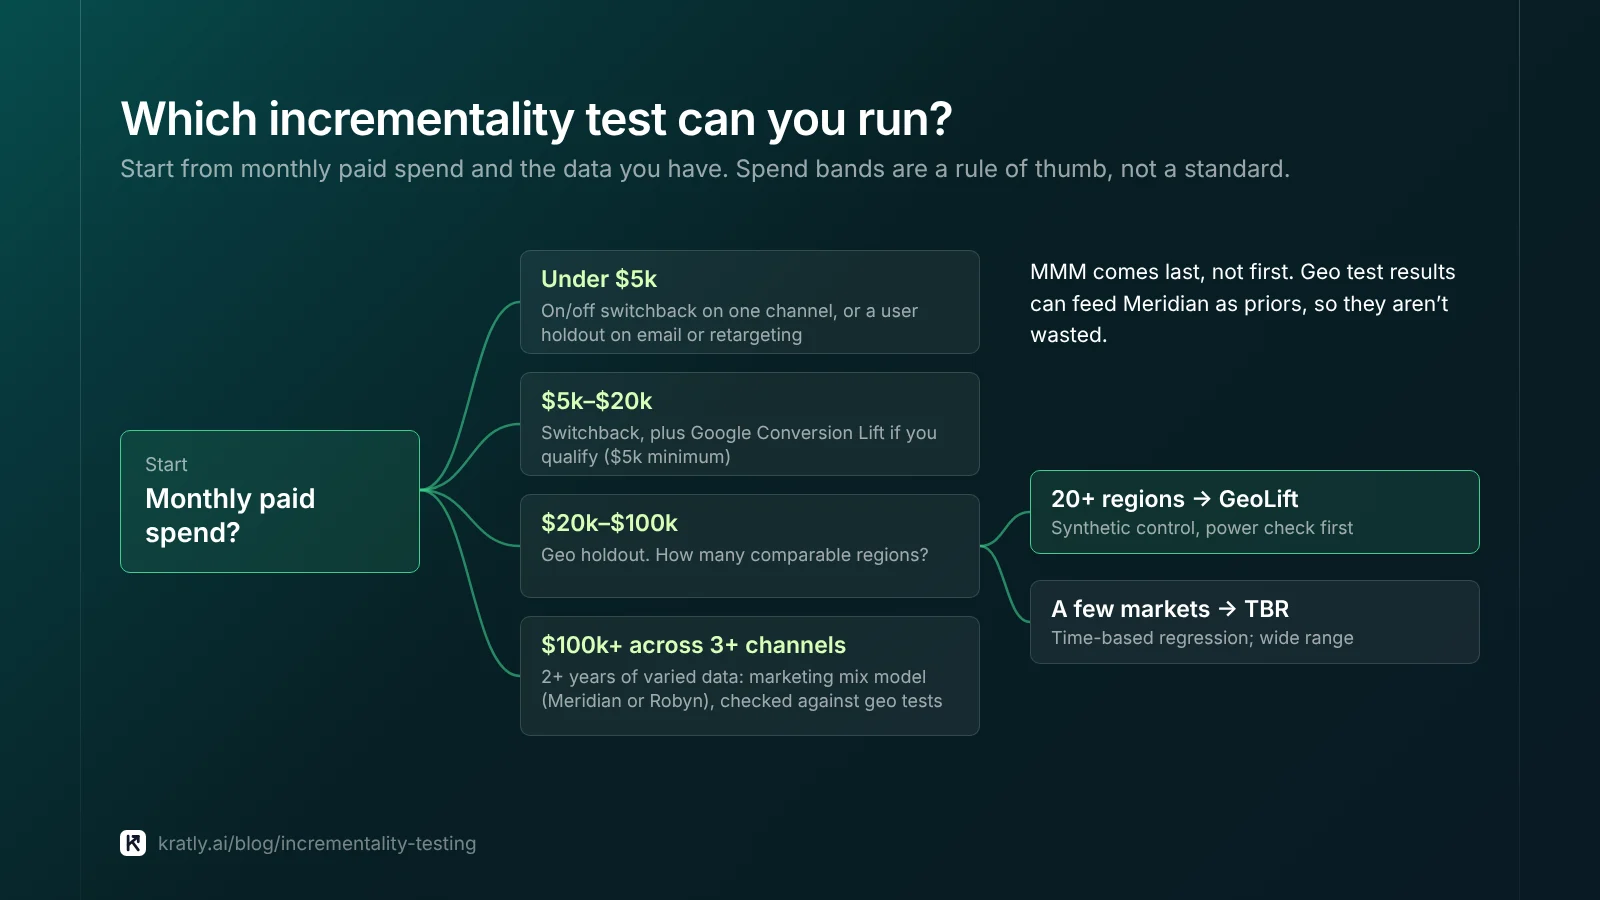
The right test depends on volume. The spend bands below are my rule of thumb, not a standard.
| Monthly paid spend | Best first test | Why | Skip for now |
|---|---|---|---|
| Under $5k | On/off switchback on one channel; user holdout on email or retargeting | Cheap, no tools needed | Geo tests, MMM |
| $5k–$20k | Switchback, plus Google Conversion Lift if you qualify | Platform lift needs $5k on Google | MMM |
| $20k–$100k | Geo holdout test with GeoLift (20+ regions) | Enough spend per region to see a lift | Full MMM |
| $100k+ across 3+ channels, 2+ years of data | MMM (Meridian or Robyn), checked against geo tests | Enough history to model | Nothing; keep testing |
Google's Conversion Lift minimum is $5,000 (Google Ads Help). Whatever you pick, measure the outcome with your SaaS marketing attribution setup, in Stripe revenue.
How do you design a geo holdout test?#
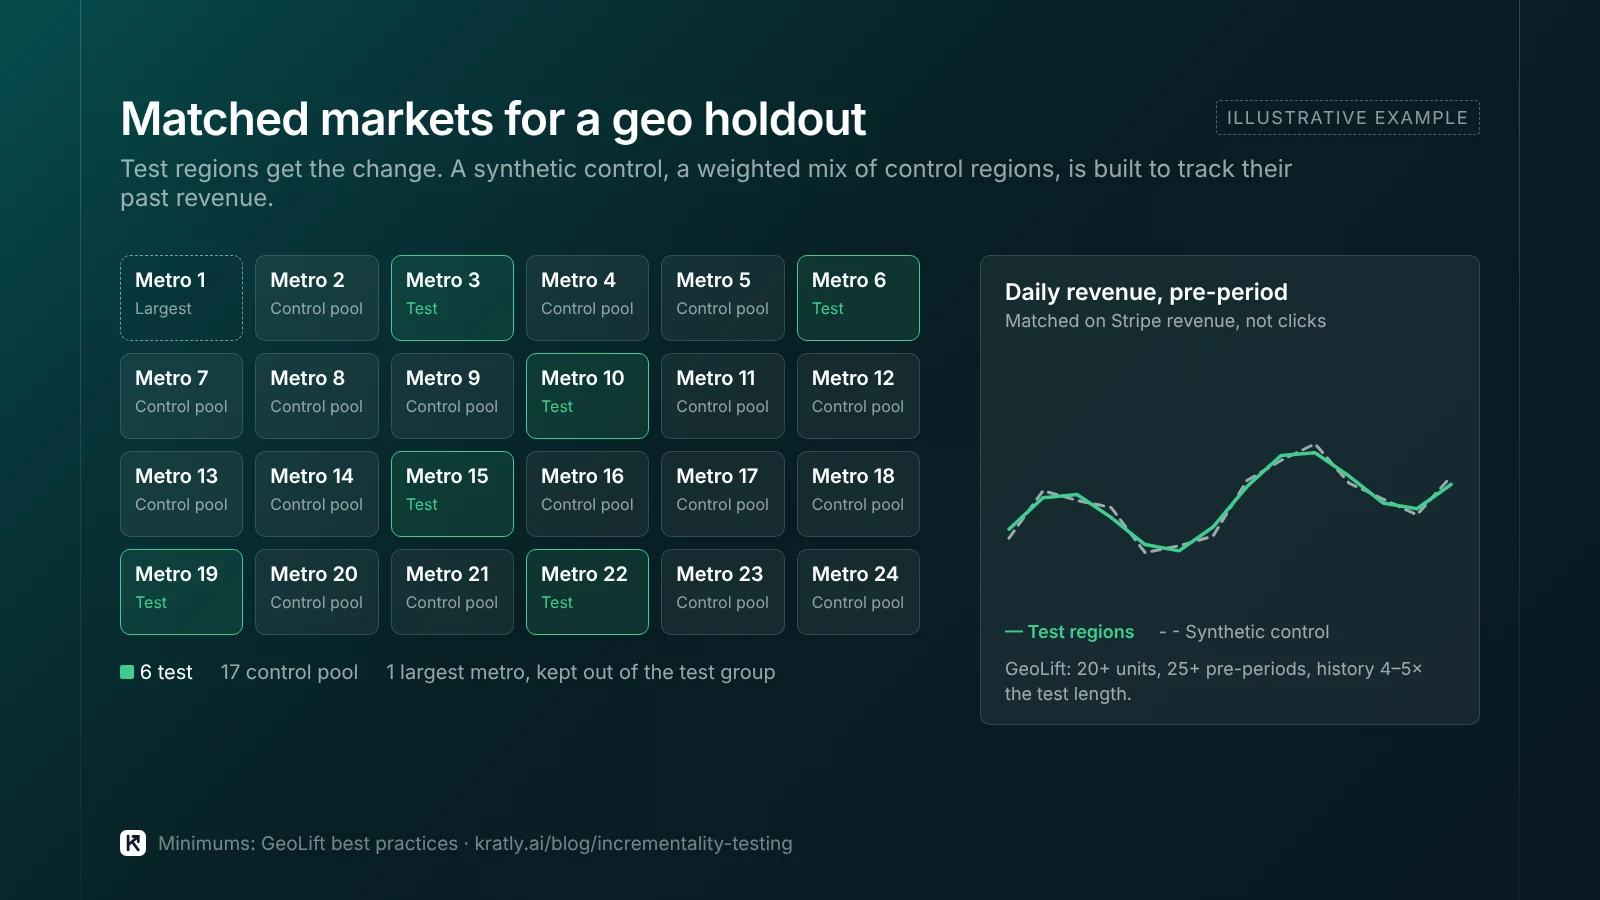
A geo holdout test turns ads off (or down) in some regions and keeps them on in matched regions. Then you compare revenue. Google researchers set out the method in 2011: assign non-overlapping regions to test or control, and serve each region its condition through geo-targeting (Vaver and Koehler, Google Research).
Meta's open-source tool GeoLift does the matching and analysis. Its best-practices page gives concrete minimums (GeoLift Best Practices):
- Units: at least 25 pre-treatment periods of 20 or more geo units.
- History: 4–5x the test length in stable pre-period data. Ideally the last 52 weeks.
- Length: at least 15 days with daily data, or 4–6 weeks with weekly data. Cover at least one purchase cycle.
- Granularity: daily data is "strongly recommended" over weekly. Use the smallest region you can target.
- Hold everything else still: keep other local marketing constant across markets during the test.
Matched markets, in plain terms#
You don't hand-pick "similar" cities. You give the tool each region's daily revenue history. It builds a weighted mix of control regions whose past revenue tracks your test regions. GeoLift calls this a synthetic control.
Two rules I'd add. Match on Stripe or Shopify revenue, not clicks; GeoLift says to match on "the exact same outcome of interest." And keep your biggest metro out of the test group, so one region can't swing the result.
Power: will you see the lift?#
Power is the chance your test detects a lift that's really there. GeoLift's GeoLiftMarketSelection() and GeoLiftPower() functions do this. You enter the lifts you expect and it estimates whether a given set of markets and length can detect it (GeoLift Walkthrough).
If it says you need a 25% lift to see anything, don't run hoping for 5%. Make the change bigger (a full pause, not a 30% cut), run longer or add markets.
What if you only have a few markets?#
Many startups sell in a handful of cities. GeoLift's 20-unit floor rules them out.
Google published a method for this case: time-based regression (TBR). It works with few regions, even one test and one control. It uses the pre-period to predict what the test market would have done without the change (Kerman, Wang and Vaver, Google Research, 2017). Expect a wide range; treat one result as a clue, not a verdict.
Switchback tests: on/off with seasonality controls#
A switchback test turns a channel on and off in planned blocks of time. It's the cheapest test, and the easiest to misread, because time brings its own changes.
Google's research shows a stronger version, where regions swap test and control roles across several periods. Pooling them gave narrower ranges than single tests (Vaver and Koehler, 2012).
For a single-market startup, here's how I'd run one:
- Use several blocks. Say two weeks on, two off, three times. One pause can't tell your ads from a slow month.
- Pick a control series your ads don't touch, such as renewals. If it moves too, the season moved.
- Compare with the same weeks last year if you have the history.
- Drop the switch days. Ads carry over, so the days right after each switch are mixed.
- Avoid holidays, launches and price changes inside the window.
What does a holdout cost?#
Founders often skip tests because "we'd lose sales." Do the math first. Sometimes the test makes money.
Holdout cost = lost gross profit in held-out regions − spend you didn't spend there.
Lost gross profit = spend held back × true iROAS × gross margin. You don't know true iROAS yet. So price the test at a few guesses:
| If true iROAS is | Spend held back | Lost gross profit (80% margin) | Net cost of test |
|---|---|---|---|
| 0.8 | $4,000 | $2,560 | −$1,440 (you saved money) |
| 1.5 | $4,000 | $4,800 | $800 |
| 3.0 | $4,000 | $9,600 | $5,600 |
Illustrative: 20% of a $20k monthly budget held out for four weeks.
If the ads work, the test costs most, but you can then scale with proof. Break-even iROAS here is 1 ÷ 0.8 = 1.25, the same math as in our guide to what a good ROAS is.
When does marketing mix modeling make sense for startups?#
Marketing mix modeling (MMM) uses past weekly spend and sales to estimate each channel's effect. No user tracking needed. Two free, open-source options exist. Google made Meridian available to everyone on January 29, 2025. Meta's is Robyn.
The data needs are the problem for marketing mix modeling for startups:
- Robyn: the authors say a dataset "customarily" has at least two years of weekly data. Robyn warns when there's more than one variable per 10 observations. For DTC and apps, about 180 days of daily data can work (Runge et al., arXiv).
- Meridian: Google's docs work through a national model with 12 channels. Two years of weekly data gives about four data points per parameter, which they call "too low to estimate the model reliably." They suggest fewer channels, more data, or a geo-level model (Google for Developers).
My opinion: don't start an MMM under roughly $50k a month across three or more channels. Spend must also vary. Flat spend on two channels for a year gives the model nothing to learn from. Run geo tests first. Meridian can take experiment results as priors, so they aren't wasted (Google).
A worked example#
Illustrative numbers, not a real company. Back to the composite team: $30k a month on Meta, selling across the US.
- Question and rule. Does Meta prospecting add paying customers in Stripe? Cut it in half if iROAS is under 1.25.
- Data. 14 months of daily first payments by metro, no gaps.
- Markets. GeoLift picks 15 test metros (about 20% of revenue) and a synthetic control. Power analysis says a 4-week pause can detect about a 10% lift.
- Run. Prospecting off in test metros for four weeks; everything else unchanged.
- Read. Test metros came in 6% below control (range 1% to 11%). That's about $9,000 lost revenue on $6,000 held spend. iROAS is about 1.5. Meta said 3x.
- Decide. Above break-even, so prospecting stays. They trim weak ad sets and retest in six months.
How to do this in Kratly#
A note on bias: Kratly sells software in this space. GeoLift, Meridian and Robyn are free, and a spreadsheet can run a switchback. For what AI tools can do here, see AI marketing agent: what it can do, what it can't, how to choose.
- Connect Google Ads or Meta Ads and Stripe or Shopify. Kratly ties each campaign to the revenue it brought, so your test reads real payments.
- Log the test as a change. Use "Log a change" to record the pause or budget cut with its start and end dates.
- Compare revenue by campaign across periods. Look at the on and off blocks, or test and control regions, side by side.
- Decide the next step. Read the result yourself; Kratly's budget suggestions wait for your approval. Our guide on when to pause a Google Ads campaign gives the rule.
Questions, answered
How many regions do I need for a geo holdout test?
Meta's GeoLift guide recommends at least 20 geo units, with at least 25 pre-period data points each. More, smaller regions make better matches. If you only have a few markets, use Google's time-based regression method instead. It's built for as few as one test and one control region, but expect a wider range.
How long should a geo incrementality test run?
GeoLift recommends at least 15 days with daily data, or 4–6 weeks with weekly data. It should also cover at least one purchase cycle. For SaaS with a 14-day trial, I'd plan four weeks or more. You also need stable history about 4–5 times the test length before you start.
Is a switchback test as good as a geo test?
No, but it's far cheaper. A switchback compares time periods, so seasonality and news can bias it. You can reduce that with several on/off blocks, a control series your ads don't touch and same-weeks-last-year checks. Use it when you can't split by region. Treat the result as strong evidence, not proof.
What's the minimum budget for marketing mix modeling?
Neither Meridian nor Robyn sets a dollar minimum. Their limit is data. Robyn's authors say two years of weekly data is customary. Meridian's docs show two years can be too little for a 12-channel national model. My opinion: wait until you spend about $50k a month across three or more channels, with real variation.
Written by
Priyansh Kumar
Priyansh Kumar has spent more than a decade in growth, scaling brands from 1 to 10 and from 10 to 100. He now builds Kratly, an autonomous growth team that ties every campaign, page and email to the revenue it brings.
Sources
- Google Research: Measuring ad effectiveness using geo experiments (Vaver and Koehler, 2011) · Multiple-test-period geo experiments (Vaver and Koehler, 2012) · Time-based regression (Kerman, Wang and Vaver, 2017)
- Meta GeoLift (open source): Best practices · Methodology · Walkthrough
- Google for Developers: Meridian, amount of data needed
- Runge, Skokan, Zhou and Pauwels: Packaging up media mix modeling: Robyn (arXiv)
- Google: Meridian is now available to everyone (Jan 29, 2025)
- Google Ads Help: Conversion Lift requirements
Was this article useful?