Short answer
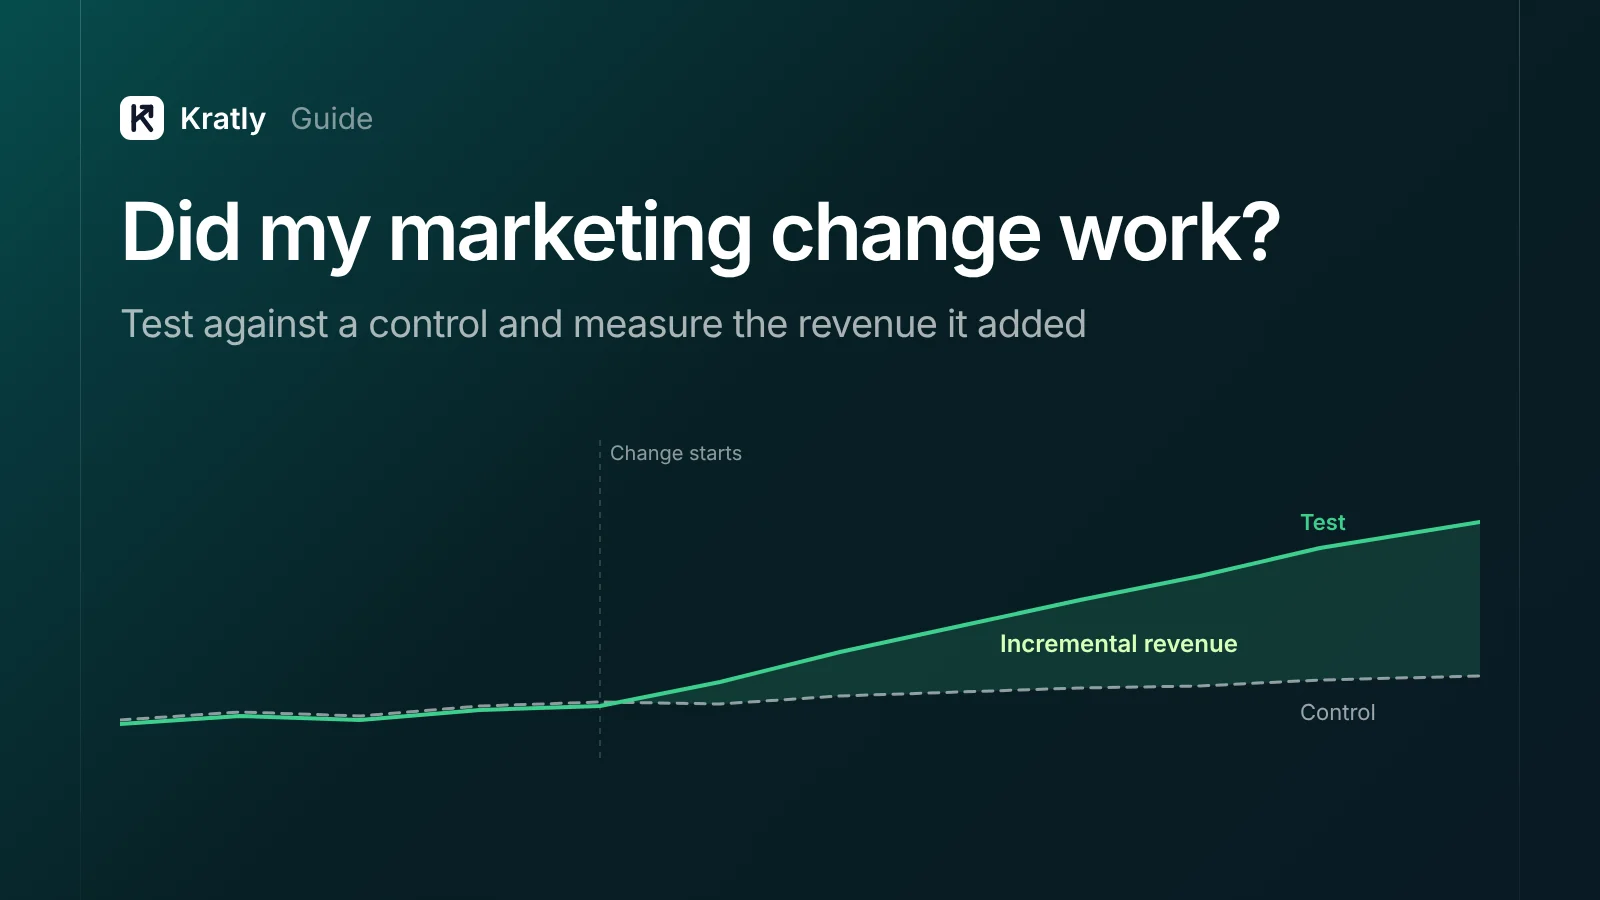
A marketing incrementality test measures what a campaign or change actually added. You split people, regions or time into a test group that gets the change and a control group that doesn't, then compare revenue. The difference is incremental revenue. Small teams can run one with a holdout, a geo split or a planned pause.
Your ad platform says the campaign worked. Your bank account isn't sure. One store owner put it plainly: "Facebook is reporting more than double the sales that Shopify reports" (Shopify Community).
Attribution tells you who touched an ad before buying. It can't tell you whether they'd have bought anyway. Only a control group can. This guide shows how to run one without a data science team.
What is a marketing incrementality test?#
An incrementality test compares a group that saw your marketing with a similar group that didn't. Google defines the key numbers this way (Google Ads Help):
- Incremental conversions: conversions in the test group minus conversions in the control group. These are sales that wouldn't have happened without the campaign.
- Incremental ROAS (iROAS): incremental conversion value ÷ ad spend.
- Relative lift: incremental conversions ÷ control conversions.
The marketing control group is the whole idea. It shows what would have happened without the change. Everything else is maths.
Incrementality testing is common now. In a 2025 EMARKETER and TransUnion survey, 52% of US marketers said they use it (EMARKETER). Most guides, though, are written by vendors for large budgets. This one is for teams spending $5k to $100k a month.
Why attribution can't answer "did it work?"#
Attribution models share credit among the touches before a sale. None of them asks whether the sale needed those touches. Our guide to attribution models covers the differences.
The best-known proof comes from eBay. Economists ran controlled tests on eBay's paid search (Blake, Nosko and Tadelis, NBER):
- When eBay paused brand keyword ads, 99.5% of the lost paid clicks came back through organic search. The ads were mostly paying for visits eBay would have got anyway.
- For non-brand keywords, the controlled experiment estimated a return of −63%. Simple, non-experimental estimates had put it in the thousands of percent.
You aren't eBay. But the lesson scales down: brand search, retargeting and returning customers can look brilliant in attribution and add little in reality.
The other common shortcut is before and after. Revenue went up after the change, so the change worked. But seasonality, a launch, a price change or a competitor's outage can all move revenue in the same weeks. Without a control, you can't separate them.
Four incrementality tests a small team can run#
| Test | How it works | Good for | Needs |
|---|---|---|---|
| Platform lift study | Google or Meta randomly hold back some users from seeing ads | Display, video, PMax, Meta campaigns | Google: $5,000 minimum budget and enough conversions; not all accounts eligible (Google Ads Help) |
| Holdout group | You exclude a random share of users or customers from a change (emails, offers, retargeting) | Lifecycle email, retargeting, onboarding | A way to split users at random; enough volume |
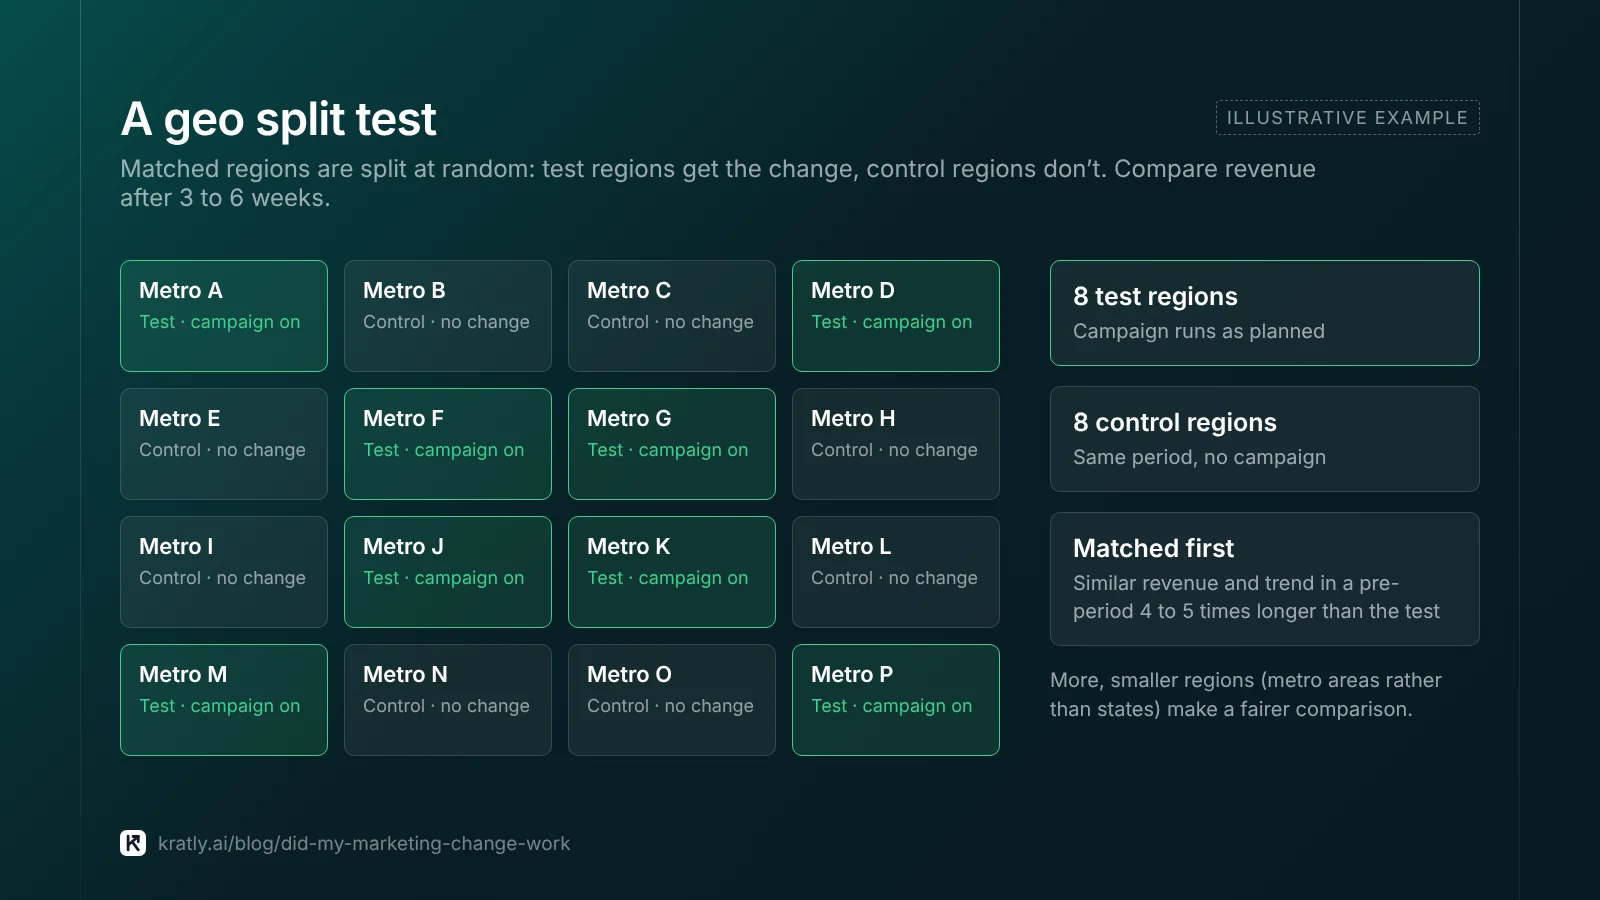
| Geo split | Run the change in some US regions, not others, and compare | Any channel you can target by location | Several comparable regions; 3–6 weeks |
| Planned pause (on/off) | Turn something off for a set period and compare with a baseline | Brand search, a single channel | A stable baseline; tolerance for a short dip |
Google's lift studies got more accessible. Google lowered its Conversion Lift threshold to $5,000 in 2025 (PPC Land). In October 2026 it opened Conversion Lift to Search and Performance Max as self-serve (Search Engine Land). Check whether your account qualifies before building your own.
Google's campaign experiments are a different tool. They split traffic between two versions of a campaign, such as two bid strategies (Google Ads Help). That tells you which version is better, not whether the campaign adds anything at all.
For geo tests, use more regions rather than fewer. US metro areas (DMAs) give you more units to match than states. Meta's open-source GeoLift tool is built for this, and practitioners suggest a pre-period four to five times longer than the test (Triple Whale).
How to run a holdout test, step by step#
This is the version most small teams can run this month, for example on a retargeting campaign or a trial email sequence.
Step 1: Write the question and the metric#
One question, one number. "Does our trial email sequence increase paid conversions within 30 days?" The metric is first payments in Stripe, not opens, clicks or platform conversions.
Step 2: Split at random, before the change#
Assign each user or customer to test or control at random, by user ID. Don't hand-pick. A 50/50 split gives an answer fastest. A 10% holdout costs less but needs more time.
For ads, put the control group in an excluded audience. For email, suppress them from the sequence.
Step 3: Size it before you start#
Use a sample size calculator such as Evan Miller's. Enter your current conversion rate and the smallest lift worth knowing about.
Be honest with the result. If you need 20,000 users per group and get 2,000 a month, a user holdout won't work. Switch to a bigger change, a longer test, or a geo split.
Step 4: Run it long enough#
Run for at least 14 days to cover two full weekly cycles. For SaaS, run long enough to cover your normal trial-to-paid time. Otherwise you'll stop before the test group pays and see a false "no lift" (Haus).
Don't peek and stop early when it looks good. Decide the end date first.
Step 5: Compare revenue, not clicks#
At the end, pull first payments and revenue from Stripe for both groups. Calculate:
- Incremental customers = test customers − control customers (scaled to the same group size)
- Incremental revenue = test revenue − control revenue (scaled)
- iROAS = incremental revenue ÷ spend
Your SaaS marketing attribution setup makes this easy, because each paying customer already carries their user ID and source.
How to read the result#
There's a clear lift. Keep the change, and note the iROAS. It's a better number for budget decisions than platform ROAS.
There's no difference. That's a result too. If the campaign added nothing, you've found money to move. This is common with brand search and broad retargeting.
It's inconclusive. The range includes both zero and a meaningful lift. Don't call it a win or a loss. Run it longer, test a bigger change, or use more regions.
Always report a range, not one number. A geo test showing "5% lift, plus or minus 4%" can mean ROAS anywhere from poor to excellent (SegmentStream).
Count the cost. A holdout gives up some revenue from the control group. That's the price of the answer. Compare it with the money you'd keep wasting if a campaign doesn't work. One agency notes that small clients often ask to cut month-long pauses short when sales dip (JumpFly). Agree on the rules before you start.
Once you know a campaign adds little, decide what to do with it. Our guide on when to pause a Google Ads campaign gives you the rule.
How to do this in Kratly#
- Choose the change to test. A campaign, a budget shift or an email sequence.
- Kratly sets up the control. It holds back a random group or matched period and records the split.
- Kratly measures Stripe revenue in both groups. It reports the extra customers and revenue the change brought against the control.
- Act on the result. Keep the changes that paid and stop the ones that didn't.
Go deeper: Incrementality testing on a small budget: holdouts for startups
Questions, answered
What is the difference between incrementality and attribution?
Attribution shares credit for a sale among the marketing touches before it. Incrementality measures whether the marketing caused the sale, by comparing with a control group that didn't see it. Attribution answers "who touched it"; incrementality answers "did it make a difference".
How long should an incrementality test run?
At least 14 days, to cover two weekly cycles, and long enough to cover your normal time from click to payment. For SaaS with a 14-day trial, that often means three to six weeks. Fix the end date before you start and don't stop early.
Can a small business run a holdout test?
Yes, if the change is big enough to show up. Holdouts on email sequences, retargeting audiences or a planned pause of brand search are within reach for most small teams. If volume is too low for a user split, use a geo split or a longer test.
What is a good incremental ROAS?
One that beats your break-even ROAS, which is 1 divided by your gross margin. At an 80% margin, break-even is 1.25. At 40%, it's 2.5. Compare iROAS with that number, not with the platform's reported ROAS, which usually runs higher.
Is a before-and-after comparison an incrementality test?
No. Before and after can't separate your change from seasonality, launches or price changes in the same weeks. It's a starting clue at best. A real test needs a control group running at the same time.
Written by
Priyansh Kumar
Priyansh Kumar has spent more than a decade in growth, scaling brands from 1 to 10 and from 10 to 100. He now builds Kratly, an autonomous growth team that ties every campaign, page and email to the revenue it brings.
Sources
- Google Ads Help: Incrementality metrics · Conversion Lift requirements · Campaign experiments
- Blake, Nosko and Tadelis: Consumer heterogeneity and paid search effectiveness (NBER)
- EMARKETER: FAQ on incrementality (2026)
- PPC Land: Google lowers incrementality testing threshold · Search Engine Land: Conversion Lift for Search and PMax
- Haus: How long to run an incrementality test · Evan Miller: Sample size calculator
Was this article useful?