Short answer
The LTV to CAC ratio divides what a customer is worth over their life by what it cost to win them. Build LTV from gross margin, not revenue. Check it against real cohort revenue from Stripe, and cap or discount the lifetime. Then compare it with paid CAC by channel. Around 3:1 is the common guideline.
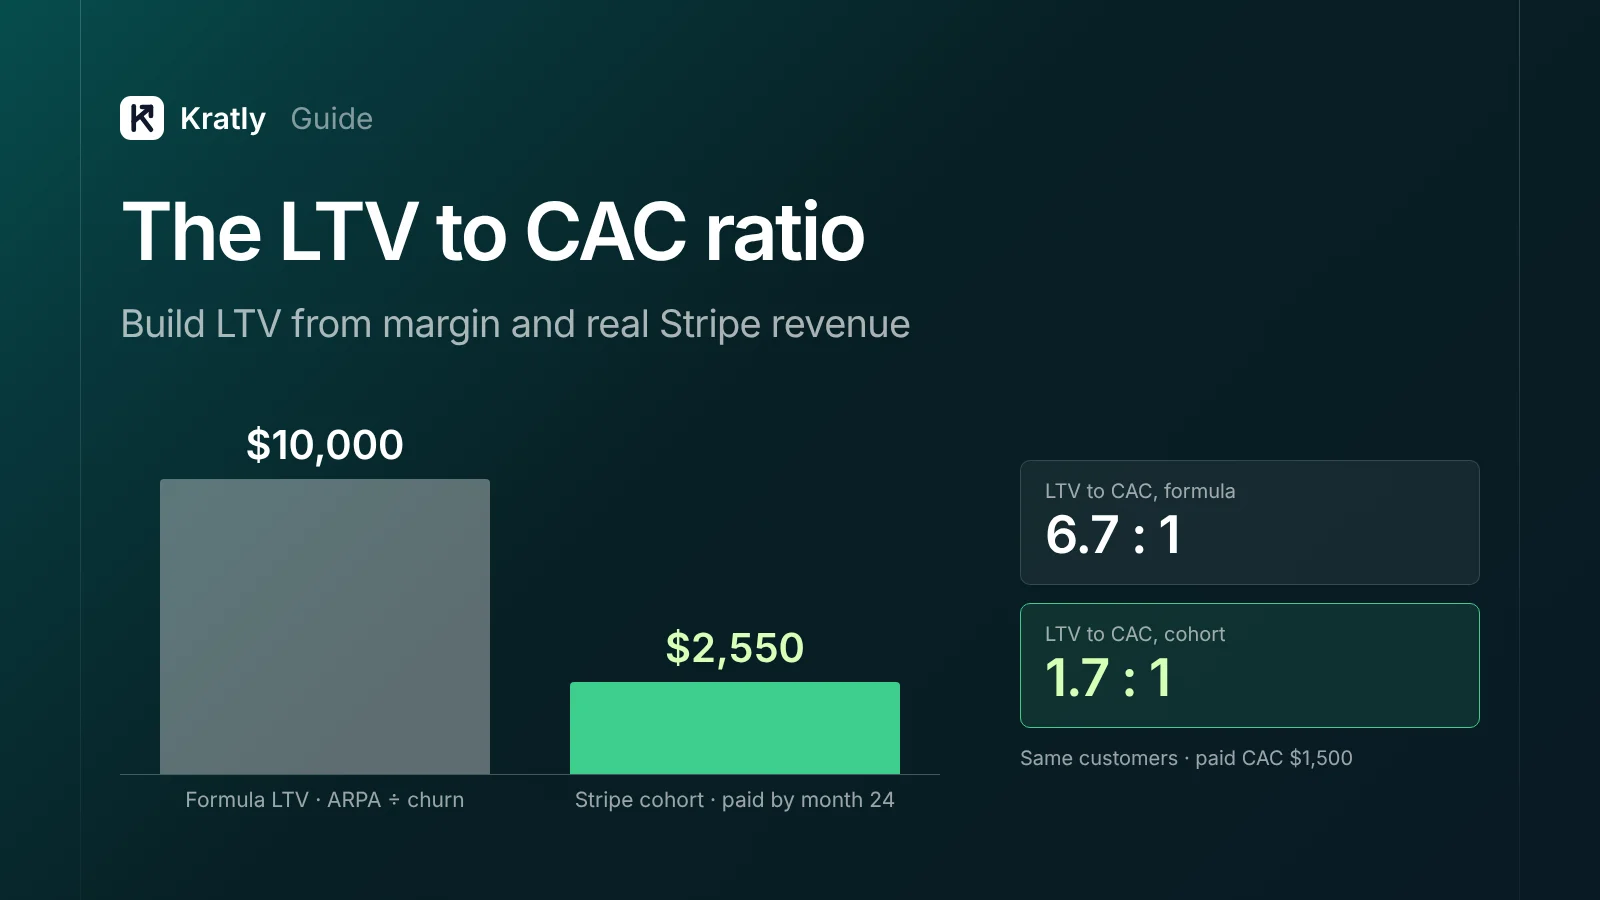
Composite example: a SaaS founder is 18 months in. Her billing dashboard shows a $10,000 LTV and paid CAC is $1,500, so she tells her board the LTV to CAC ratio is 6.7:1. Then she adds up what her first cohorts have actually paid, after refunds and costs. The ratio she can prove is closer to 1.7:1. (Made-up example, not a real company or Kratly customer.)
Both numbers came from the same customers. The gap comes from how LTV is built, so this guide is about that half of the ratio. The CAC side is in how to calculate CAC by channel, and payback in CAC payback period benchmarks. Both feed the bigger picture in SaaS marketing attribution.
What is the LTV to CAC ratio?#
The LTV to CAC ratio is the gross profit a customer brings over their life divided by the full cost of acquiring them.
A ratio of 3 means each acquisition dollar returns three dollars of margin. It sounds precise. It isn't. CAC is money you've already spent. LTV is mostly money you haven't received yet, so I'd build it from what customers have actually paid, then extend it with care.
Which LTV formula should you use?#
Tools and investors use at least four.
| Formula | How it works | Who uses it |
|---|---|---|
| Simple | Average revenue per account ÷ monthly churn | Stripe Billing and Baremetrics dashboards (vendor docs) |
| Margin-adjusted | ARPA × gross margin ÷ monthly churn | ChartMogul's general formula; Skok's accurate version |
| Contribution or net profit | Monthly contribution margin × (1 ÷ monthly churn) | a16z's definition |
| Cohort, historical | Actual margin paid per customer by month 12 or 24 | a16z's preferred view for young companies |
Stripe Billing divides ARPU by subscriber churn rate (Stripe Docs). Baremetrics divides average MRR per customer by user churn (Baremetrics). Neither dashboard figure takes out costs. ChartMogul's general formula adds margin: "LTV = ARPA × Gross Margin ÷ Customer Churn Rate" (ChartMogul).
Andreessen Horowitz defines LTV as "the present value of the future net profit from the customer" (a16z). It calls revenue or gross margin LTV "a common mistake."
My pick: margin-adjusted LTV for planning, checked against cohorts. If they disagree by over a third, believe the cohort.
Why does simple LTV overstate?#
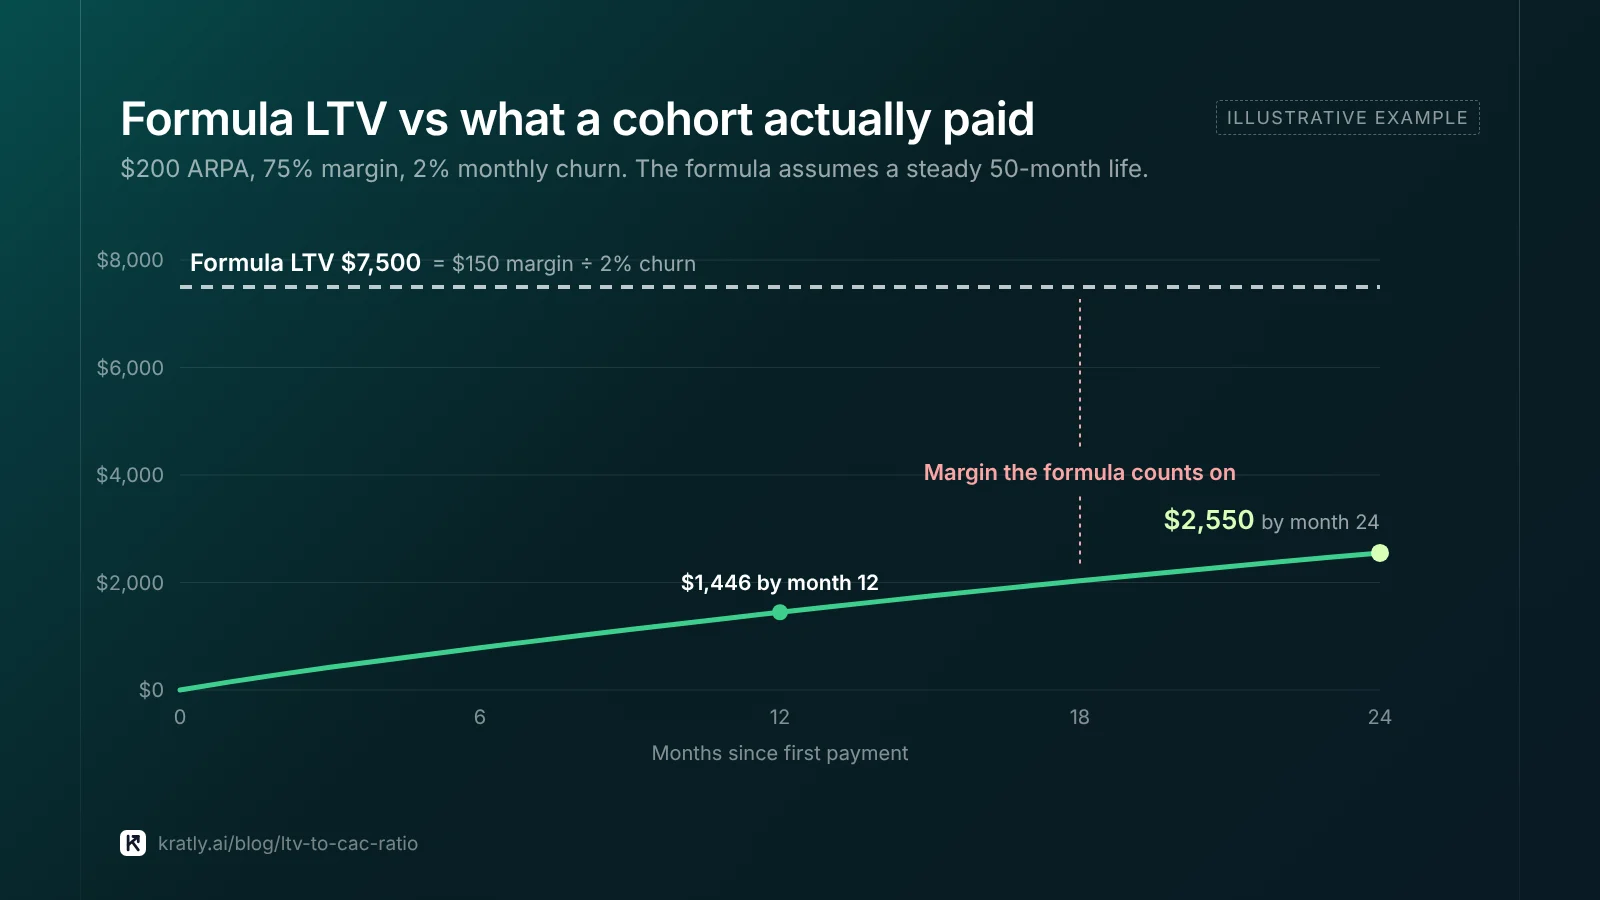
The simple formula assumes churn is steady forever. Real customers don't behave that way.
- Churn isn't flat. ChartMogul says churn is highest in the first three months. Its 2026 analysis found LTV "tends to overestimate revenue at 12 months but underestimate it by 24 and 36 months" (ChartMogul, vendor data). Without cohorts, you can't tell which way you're wrong.
- Small churn makes huge lifetimes. At 2% monthly churn, lifetime is 50 months. At 1%, it's 100 months. Stripe assumes a 60-month lifetime when churn is 0% (Stripe Support).
- Annual plans hide churn. Churn looks near zero until the first renewals come due.
- Revenue isn't profit. Hosting, payment fees and support come out first.
- Future money is worth less. David Skok says CFOs know undiscounted LTV "is too high." He suggests a discount rate of 15% for private companies scaling predictably. For those not yet at scale, he suggests 20–25% (For Entrepreneurs).
The fix I'd use: cap lifetime at 3 to 5 years, or discount at 15–25%. For young companies, a16z prefers "historical value to date," measured as 12-month and 24-month LTV (a16z).
Where the 3:1 rule came from, and when it's wrong#
The 3:1 guideline comes from David Skok's SaaS Metrics 2.0. He writes that LTV to CAC "should be higher than 3" for a successful SaaS business (For Entrepreneurs). The assumptions behind it are covered in our CAC payback guide.
A 2017 post on Skok's site by Jared Sleeper adds two rules people skip. The numbers only become "meaningful and reliable" once growth is repeatable and scalable. And "LTV:CAC ratios are to be used, not believed" (For Entrepreneurs).
How I'd read your number (my judgment, not a benchmark):
| Ratio (margin-based, capped) | What it usually means | What I'd do |
|---|---|---|
| Under 1 | You lose money on each customer | Cut the worst channel first |
| 1 to 3 | Works only if payback is short | Fix price, margin or conversion |
| 3 to 5 | Healthy for most SaaS | Scale carefully, watch payback |
| Over 5 | Likely underinvesting, or LTV is inflated | Check the LTV, then spend more |
A very high ratio is not a trophy. The post says underinvesting "is leaving money on the table." A rival at 3:1 with twice your budget can outgrow you.
3:1 is also wrong when payback is long and cash is short, and before your growth is repeatable. For what changes as you scale spend, see how to scale SaaS to $10M ARR.
LTV to CAC by channel, with blended vs paid CAC#
One company-wide ratio hides the real decision: where to put the next dollar. Channels bring different customers. Search buyers who typed a problem may stay longer than people who clicked a social ad. So both halves of the ratio change by channel. To build it:
- Tag each paying customer with a first-touch source, as in CAC by channel.
- Group customers by channel and acquisition quarter.
- Sum the margin each group has paid to date.
- Divide by that channel's paid CAC for the same quarter.
On blended CAC vs paid CAC: never pair a channel's LTV with blended CAC. It includes cheap organic customers, so paid spend looks better than it is. Blended CAC suits a company-wide ratio; paid CAC by channel suits budget calls.
Marketing efficiency ratio: the store owner's check#
The marketing efficiency ratio (MER) is total revenue divided by total marketing spend for the same period. It's covered next to ROAS in what is a good ROAS.
For online stores, LTV to CAC is harder. There's no churn rate, just repeat orders at random gaps. So I'd run a store on two numbers:
- MER weekly. It needs no attribution, so ad platforms can't inflate it.
- 12-month LTV to CAC quarterly. Sum each month's new Shopify customers' margin over 12 months, then divide by that month's acquisition cost.
MER has a blind spot: it includes returning customers you'd have kept anyway. A strong MER can hide stalled acquisition. New-customer MER fixes that: first-order revenue from new buyers divided by spend. For SaaS, revenue lags spend by months, so I'd use MER only as a monthly sanity check.
How to calculate it from Stripe exports#
A spreadsheet works. Allow three to four hours.
- Download the Billing reports. Prebuilt reports include "MRR per subscriber per month" and "Customer MRR changes" (Stripe Docs). They show each customer's start month and every change.
- Pull payments and refunds. The Balance Summary report covers "payments, refunds, disputes, and fees" (Stripe Support). Net them out per customer. MRR is not cash received.
- Check your MRR settings. Stripe lets you subtract discounts from MRR, the more conservative option.
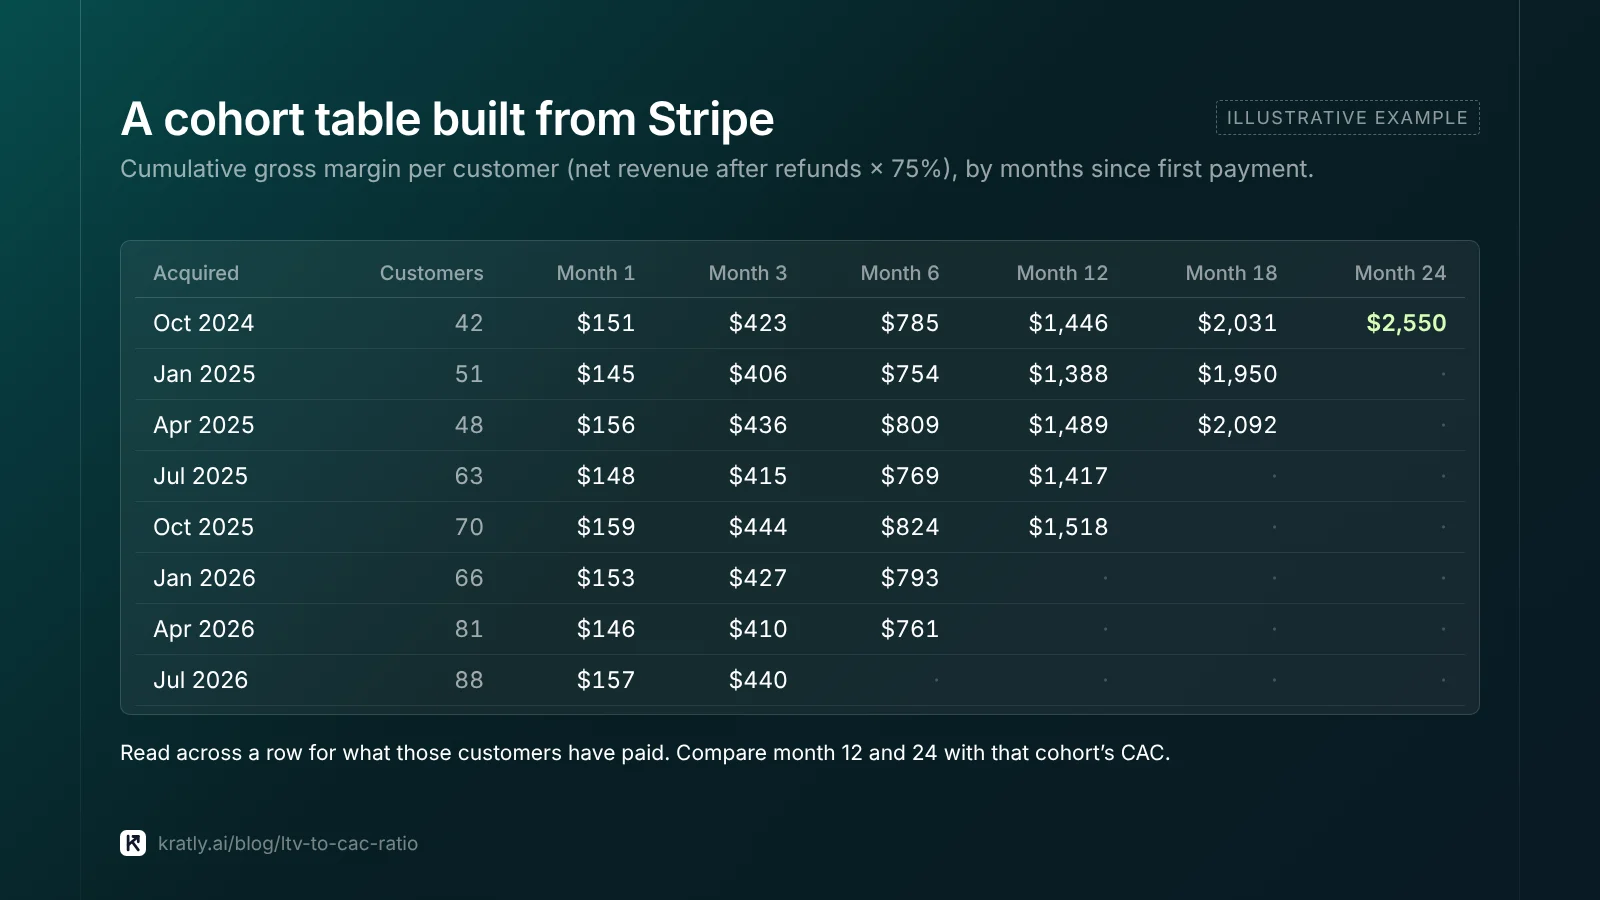
- Build a cohort table. Rows are acquisition months, columns are months since start. Each cell is cumulative net revenue per customer.
- Apply gross margin, after hosting, payment fees and support.
- Divide by CAC for the same cohort, using paid CAC by channel where you can.
This is recurring manual work, the kind an AI marketing agent can take over if it reads Stripe directly.
A worked example (illustrative numbers)#
These numbers are made up to show the method. They are not from a real company.
A SaaS company has $200 ARPA, 2% monthly churn and 75% gross margin ($150 a month). Paid CAC is $1,500.
| Method | LTV | LTV to CAC |
|---|---|---|
| Simple: $200 ÷ 2% | $10,000 | 6.7 |
| Margin-adjusted: $150 ÷ 2% | $7,500 | 5.0 |
| Margin, capped at 60 months | $5,268 | 3.5 |
| Margin, 60 months, discounted at 15% a year | $4,077 | 2.7 |
| Margin, capped at 36 months | $3,876 | 2.6 |
| Cohort: margin actually paid by month 24 | $2,550 | 1.7 |
Same customers; the ratio runs from 6.7 to 1.7. I'd report the cohort figure as the floor and the discounted one as the estimate. If the cohort curve still climbs toward 3, keep spending. If it has flattened, fix churn or pricing.
How to do this in Kratly#
- Connect Stripe or Shopify, your ad accounts and your site. Kratly ties each paying customer to the campaign, page or email that brought them.
- Apply your gross margin yourself. Kratly shows revenue per customer; multiply by your margin to get the LTV used above.
- Review revenue by acquisition month and channel, next to cost per paying customer.
- Approve budget suggestions. Kratly suggests shifts between channels. You approve each one, and every change is logged and reversible.
Questions, answered
What is a good LTV to CAC ratio?
Around 3:1 is the common guideline, from David Skok's SaaS Metrics 2.0. Its assumptions are covered in our CAC payback guide. Below 1 means you lose money on each customer. Above 5 often means LTV is inflated or you're underinvesting in growth. Build it from margin and cohort revenue before you trust it.
How do you calculate LTV for a SaaS company?
The common formula is average revenue per account times gross margin, divided by monthly churn. With $200 revenue, 75% margin and 2% churn, LTV is $7,500. Cap the lifetime at three to five years or discount it. Then compare it with what real cohorts have paid in Stripe by months 12 and 24.
Why is my Stripe LTV so high?
Stripe Billing divides average revenue per user by subscriber churn. It doesn't subtract hosting, fees or support costs, and it doesn't discount future revenue. Low churn creates very long lifetimes, and Stripe assumes 60 months when churn is zero. Annual plans can also hide churn until renewal. Treat it as an upper bound.
Is MER better than LTV to CAC for ecommerce?
For weekly decisions, often yes. MER is total revenue divided by total marketing spend, so it needs no attribution. But it mixes in returning customers. Track MER weekly and a 12-month LTV to CAC by acquisition month quarterly, built from orders in Shopify. Together they show both efficiency and new-customer health.
Written by
Priyansh Kumar
Priyansh Kumar has spent more than a decade in growth, scaling brands from 1 to 10 and from 10 to 100. He now builds Kratly, an autonomous growth team that ties every campaign, page and email to the revenue it brings.
Sources
- Andreessen Horowitz: 16 Startup Metrics (Aug 2015)
- For Entrepreneurs (David Skok): SaaS Metrics 2.0 · What's your true customer lifetime value? DCF provides the answer (Dec 2015) · Jared Sleeper, Why early-stage startups should wait to calculate LTV:CAC (Jun 2017)
- Stripe Docs: Billing analytics · Stripe Support: Calculating subscriber lifetime value · Exporting a report of all transactions
- ChartMogul: LTV, SaaS metrics library (vendor)
- Baremetrics: SaaS LTV models (vendor)
Was this article useful?