Short answer
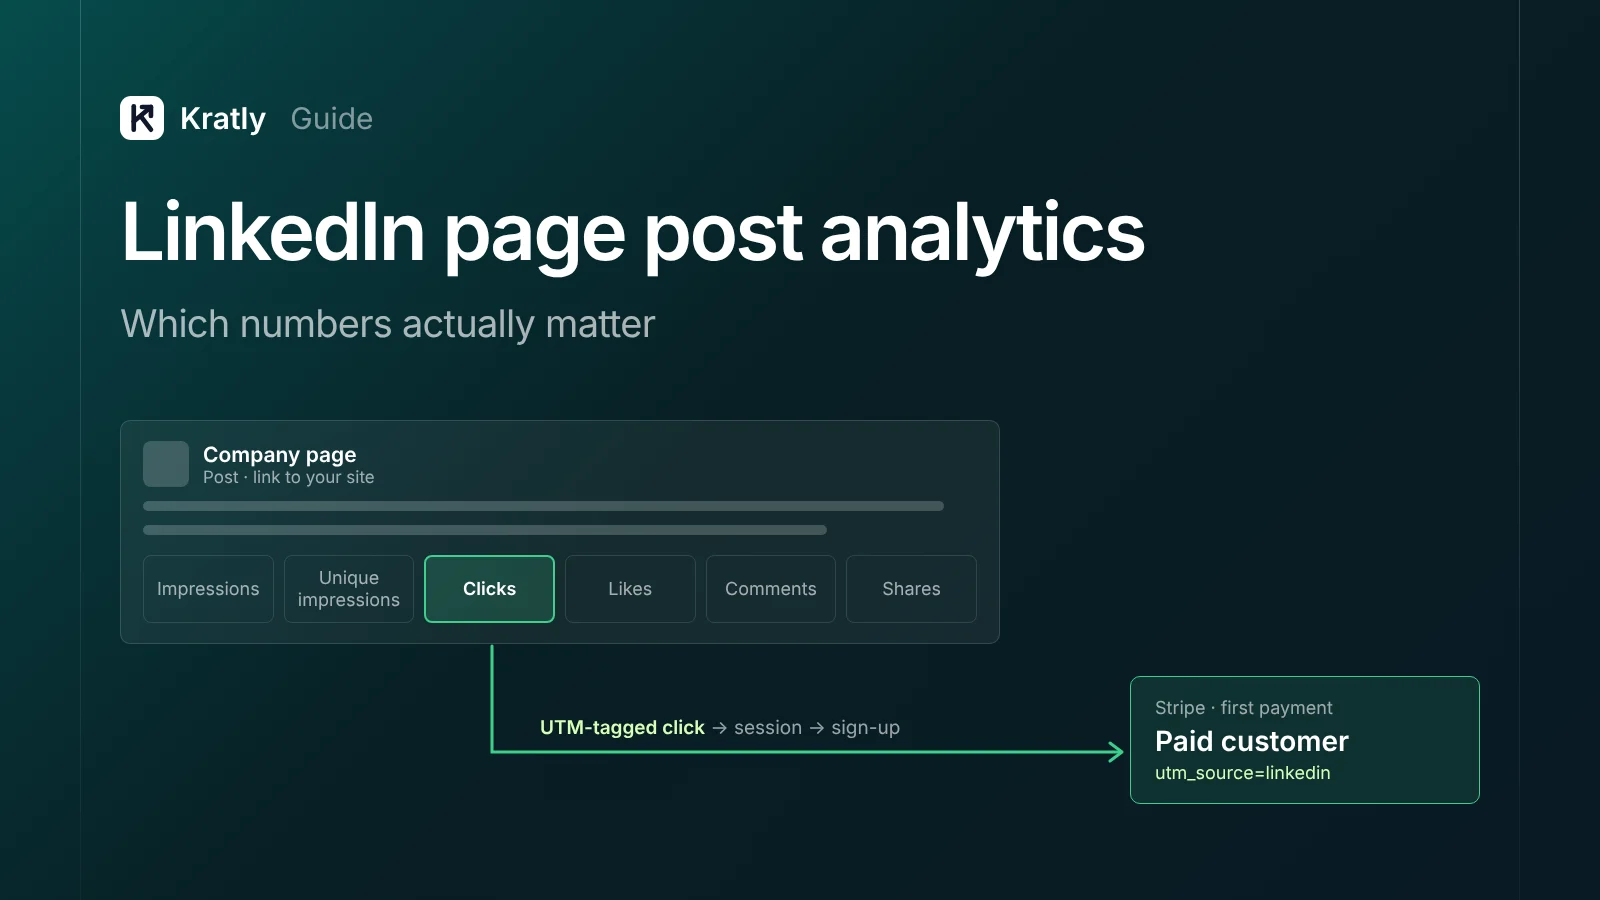
LinkedIn page post analytics give six counts per post: impressions, unique impressions, clicks, likes, comments and shares. LinkedIn's API adds an engagement rate: organic clicks, likes, comments and shares over impressions. For revenue, track clicks to your site with UTM tags, then sign-ups and payments. Treat the rest as reach signals.
Composite example: a founder posts on the company page every weekday. One post gets 9,000 impressions and 140 likes. Another gets 2,000 impressions and 30 likes. The quiet one brought the only two trials of the month. Nobody noticed, because the links had no UTM tags.
All facts below are as of November 2026.
Where do LinkedIn page post analytics come from?#
You see post numbers in two places. One is the Analytics tab on your LinkedIn Page. The other is LinkedIn's Marketing API, which reporting tools call on your behalf.
In the API, post results come from one endpoint: organizationalEntityShareStatistics. It returns organic statistics for a company page's posts, as a lifetime total or by day or month (LinkedIn Marketing API docs).
Three limits from that page matter:
- Organic only. Sponsored activity is left out. Paid results live in Ad Analytics, covered in LinkedIn ads for SaaS: measure paying customers, not leads.
- Twelve months. The endpoint returns share data only for the past 12 months. Export older numbers before they age out.
- Per-post numbers are lifetime only. You can ask for one post's statistics, but not split by day. Daily and monthly splits work only at the page level.
What does each post metric mean?#
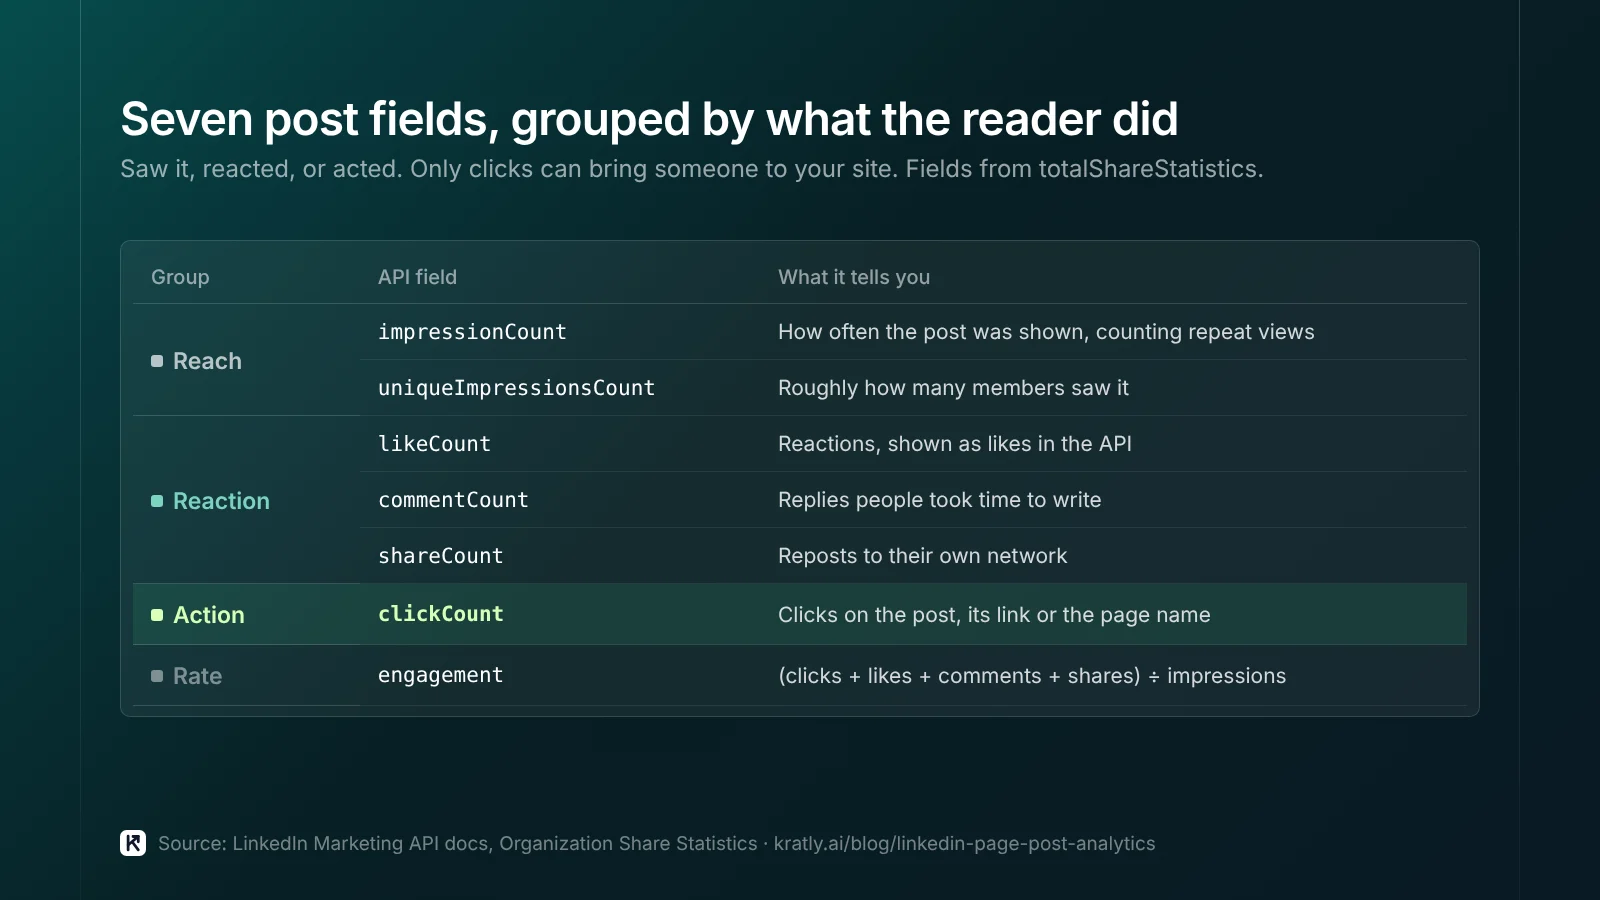
Here are the seven fields in the API's totalShareStatistics object, with LinkedIn's own wording (share statistics schema).
| API field | LinkedIn's definition | What it tells you |
|---|---|---|
impressionCount | "Number of impressions." | How often the post was shown, counting repeat views |
uniqueImpressionsCount | "Number of unique impressions." | Roughly how many members saw it |
clickCount | "Number of clicks." | Clicks on the post, its link or the page name |
likeCount | "Number of likes." | Reactions, shown as likes in the API |
commentCount | "Number of comments." | Replies people took time to write |
shareCount | "Number of shares." | Reposts to their own network |
engagement | "Number of organic clicks, likes, comments, and shares over impressions." | A rate, not a count |
Two quirks are worth knowing. First, likeCount "can become negative." That happens when someone likes a sponsored post and later unlikes it. The like was paid, but the unlike counts as organic. Second, shareCount in day or month results won't match the lifetime total. Time-bound data excludes instant reposts.
A note on clickCount: the API docs don't break it down by target. In my reading it mixes link clicks with clicks on the post itself. Treat it as an upper limit on site visits.
Impressions vs unique impressions#
LinkedIn impressions vs unique impressions is the difference between views and viewers. An impression counts each time the post is shown. A unique impression counts each member once, however many times they saw it.
If a post has 3,000 impressions and 2,000 unique impressions, the average viewer saw it 1.5 times. That is plain division, not a LinkedIn benchmark.
Which one should you report?
- Unique impressions for reach. It is the closer answer to "how many people saw this?"
- Impressions for engagement rate, because that is the base LinkedIn's API divides by.
A big gap is not bad. In a small target market, repeat views can be what you want.
One caution for API users. The time-bound sample on LinkedIn's page shows a uniqueImpressionsCounts key in only one element. Check a live response before you build a daily reach chart on it.
How is LinkedIn post engagement rate calculated?#
LinkedIn's API defines engagement as "organic clicks, likes, comments, and shares over impressions" (LinkedIn Marketing API docs). Written out, the LinkedIn post engagement rate is:
Engagement rate = (clicks + likes + comments + shares) ÷ impressions
I couldn't open LinkedIn's in-app help page to compare its wording, so this is the API's definition. It is also the formula I use. If you build your own report, use the same formula so numbers line up with what tools pull from the API.
Worked example (assumed numbers): a post gets 4,000 impressions, 60 clicks, 50 likes, 8 comments and 2 shares. That's 120 actions. 120 ÷ 4,000 = 3.0%.
Half of that 3.0% is clicks. Engagement rate mixes cheap actions (a like) with costly ones (a click away from the feed). So it ranks posts poorly by business value.
Some third-party tools divide by unique impressions or followers, so their rates look higher. Check the base before comparing.
Which numbers predict pipeline?#
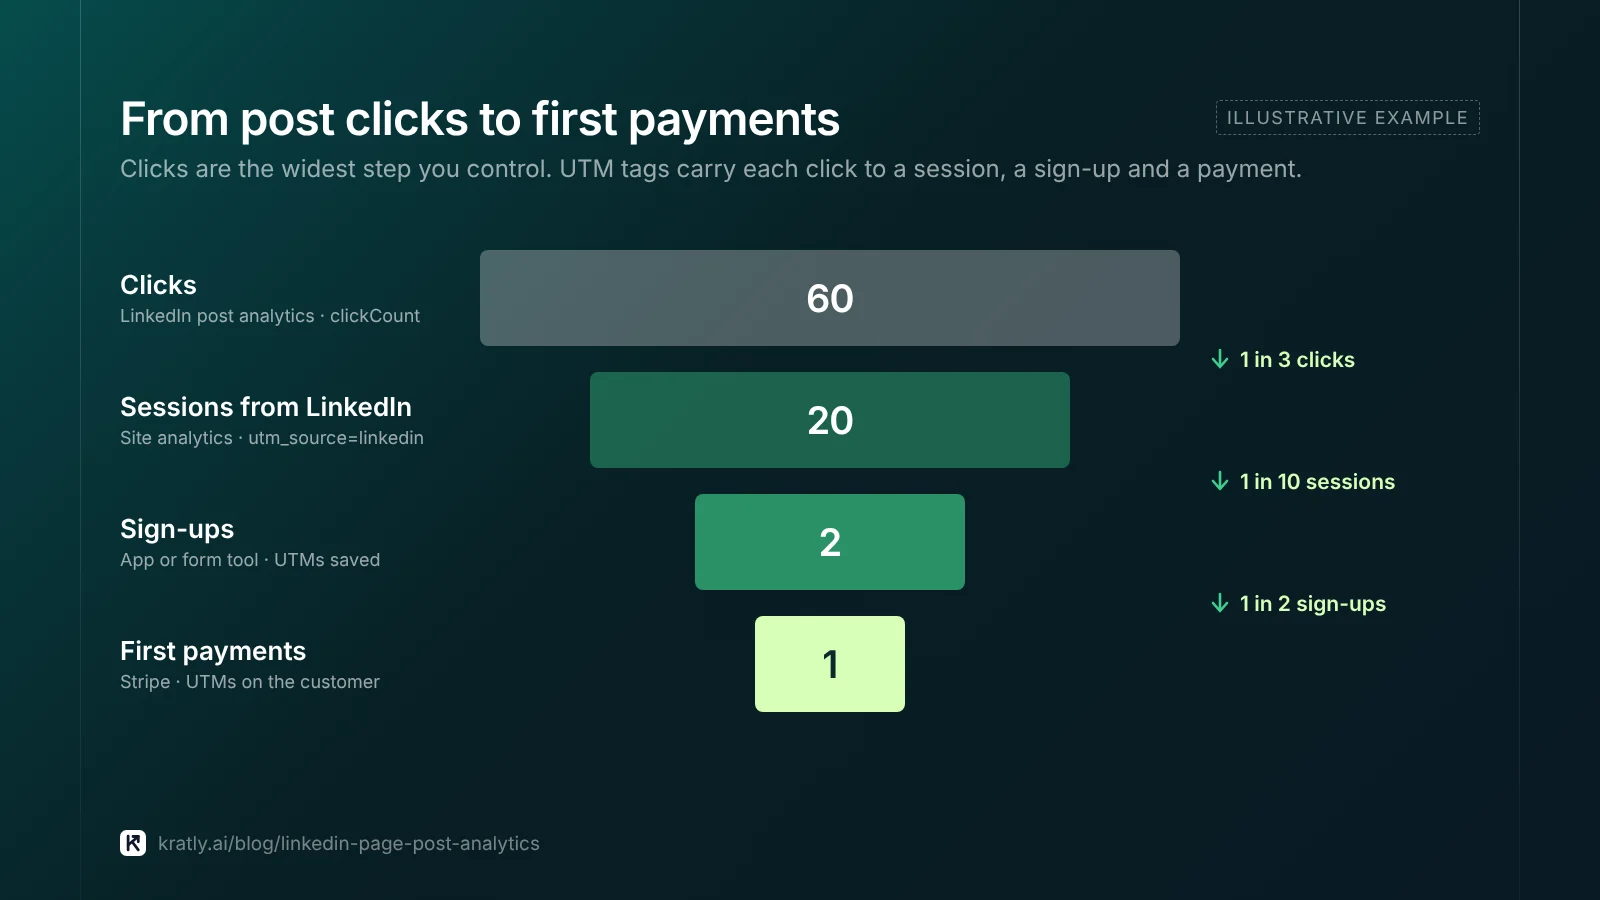
None of the six counts sits next to revenue. Clicks come closest, because a click is the only action that can bring someone to your site. Here is the chain I'd track, in order:
| Step | Where the number lives | What to record |
|---|---|---|
| 1. Clicks | LinkedIn post analytics | clickCount per post |
| 2. Sessions from LinkedIn | GA4 or your site analytics | Visits tagged utm_source=linkedin |
| 3. Sign-ups or demo requests | Your app or form tool | Sign-ups with the UTM tags stored |
| 4. Payments | Stripe or your billing tool | First payments from those sign-ups |
Step 1 to 2 needs UTM tags. Without them, most LinkedIn visits look like generic referrals or direct traffic. Use utm_source=linkedin and utm_medium=social. Google's default channel group puts social into Organic Social (Google Analytics Help). Put the post date or topic in utm_campaign. The full system is in UTM naming convention: a simple system your team will follow.
Step 3 to 4 needs the tags saved at sign-up. Copy the UTM values onto the customer record in your billing tool. Stripe lets you attach metadata to customers for this (Stripe docs). Stripe UTM tracking: see which campaign every payment came from shows the setup.
Which ratio to watch: sessions per click. If LinkedIn says 60 clicks and GA4 shows 20 tagged sessions, two-thirds of clicks didn't reach your site. Those were likely clicks on "see more," images or your page name. Track this per post format.
What I'd report each week: tagged sessions, sign-ups and first payments from LinkedIn posts, on the same sheet as paid channels. The weekly growth review meeting: 30 minutes that move revenue has a scoreboard you can copy.
What to ignore, or read with care#
Likes on their own. A like costs the reader one tap. It helps the post spread, but it says little about buying intent. Don't rank posts by likes.
Engagement rate across post types. Text posts with no link can't earn link clicks. Comparing their rate with link posts mixes two kinds of action.
Follower growth as a goal. Followers raise the reach of future posts. They are not buyers. Watch it monthly, not weekly.
Comments, read with care. Comment counts can look strong because of a few colleagues. Read who commented. Five comments from target buyers beat fifty from your own team.
Meta made a similar shift in 2026, moving away from post impressions on Facebook and Instagram. See Facebook post insights metrics in 2026: what replaced impressions for the details.
API versions: the November 16, 2026 deadline#
If you or a tool reads these numbers by API, check the version header. LinkedIn says "versioned API releases follow a monthly cycle." Each version is "supported and stable for a minimum of one year before sunset" (LinkedIn versioning docs).
The same page states: "The Marketing Version 202511 (Marketing November 2025) will be sunset on November 16, 2026." The latest version listed is 202610. LinkedIn returns an error when the version header is deprecated, and "the latest version is not applied by default."
The fix is usually small. You change the Linkedin-Version header value, for example from 202511 to 202610. Then read the recent changes page for anything that touches your endpoints. I found no 2026 change there to the share statistics fields.
Using a reporting tool? Ask the vendor which version it sends. If a dashboard goes blank in mid-November, check this first.
Where Kratly fits#
Kratly publishes to LinkedIn company pages after a person approves each post, and that part is live. Reading each post's impressions, clicks and reactions is built and switches on once LinkedIn grants page statistics access. Live today: with UTM-tagged links, Kratly shows which posts brought sign-ups and payments, next to your other channels.
Questions, answered
What is the difference between impressions and unique impressions on LinkedIn?
Impressions count every time your post was shown, including repeat views by the same member. Unique impressions count each member once. So 3,000 impressions and 2,000 unique impressions means each viewer saw the post 1.5 times on average. Use unique impressions to describe reach. Use impressions as the base for engagement rate, since that is what LinkedIn's API divides by.
How does LinkedIn calculate post engagement rate?
LinkedIn's Marketing API defines engagement as organic clicks, likes, comments and shares divided by impressions. Add the four counts, then divide by impressions. For example, 120 actions on 4,000 impressions is 3.0%. Many third-party tools divide by unique impressions or followers instead, so their rates look higher. Check the base before comparing with any benchmark.
Which LinkedIn post metric matters most for B2B?
Clicks, because a click is the only action that can bring a buyer to your site. But clicks alone don't prove value. Tag post links with UTM parameters, then follow those visits to sign-ups and first payments. A post with few likes but two paying sign-ups beat a viral post with none. Report the chain, not a single count.
How far back can I see LinkedIn page post analytics?
Through the API, the share statistics endpoint returns data only for the past 12 months. Statistics for a single post come as a lifetime total, not split by day. If you want long-term trends or weekly changes per post, export the numbers each month and keep your own copy. Check the in-app Analytics tab for its own date ranges.
Why did my LinkedIn analytics tool stop working in November 2026?
One likely reason is the API version. LinkedIn sunsets Marketing API version 202511 on November 16, 2026. LinkedIn returns an error for a deprecated version header and does not apply the latest version by default. Ask your vendor or developer which version header they send, and move to a current one such as 202610.
Written by
Priyansh Kumar
Priyansh Kumar has spent more than a decade in growth, scaling brands from 1 to 10 and from 10 to 100. He now builds Kratly, an autonomous growth team that ties every campaign, page and email to the revenue it brings.
Sources
- LinkedIn Marketing API docs (Microsoft Learn): Organization Share Statistics · LMS API versioning · Recent Marketing API changes
- Google Analytics Help: Default channel group
- Stripe docs: Metadata
Was this article useful?