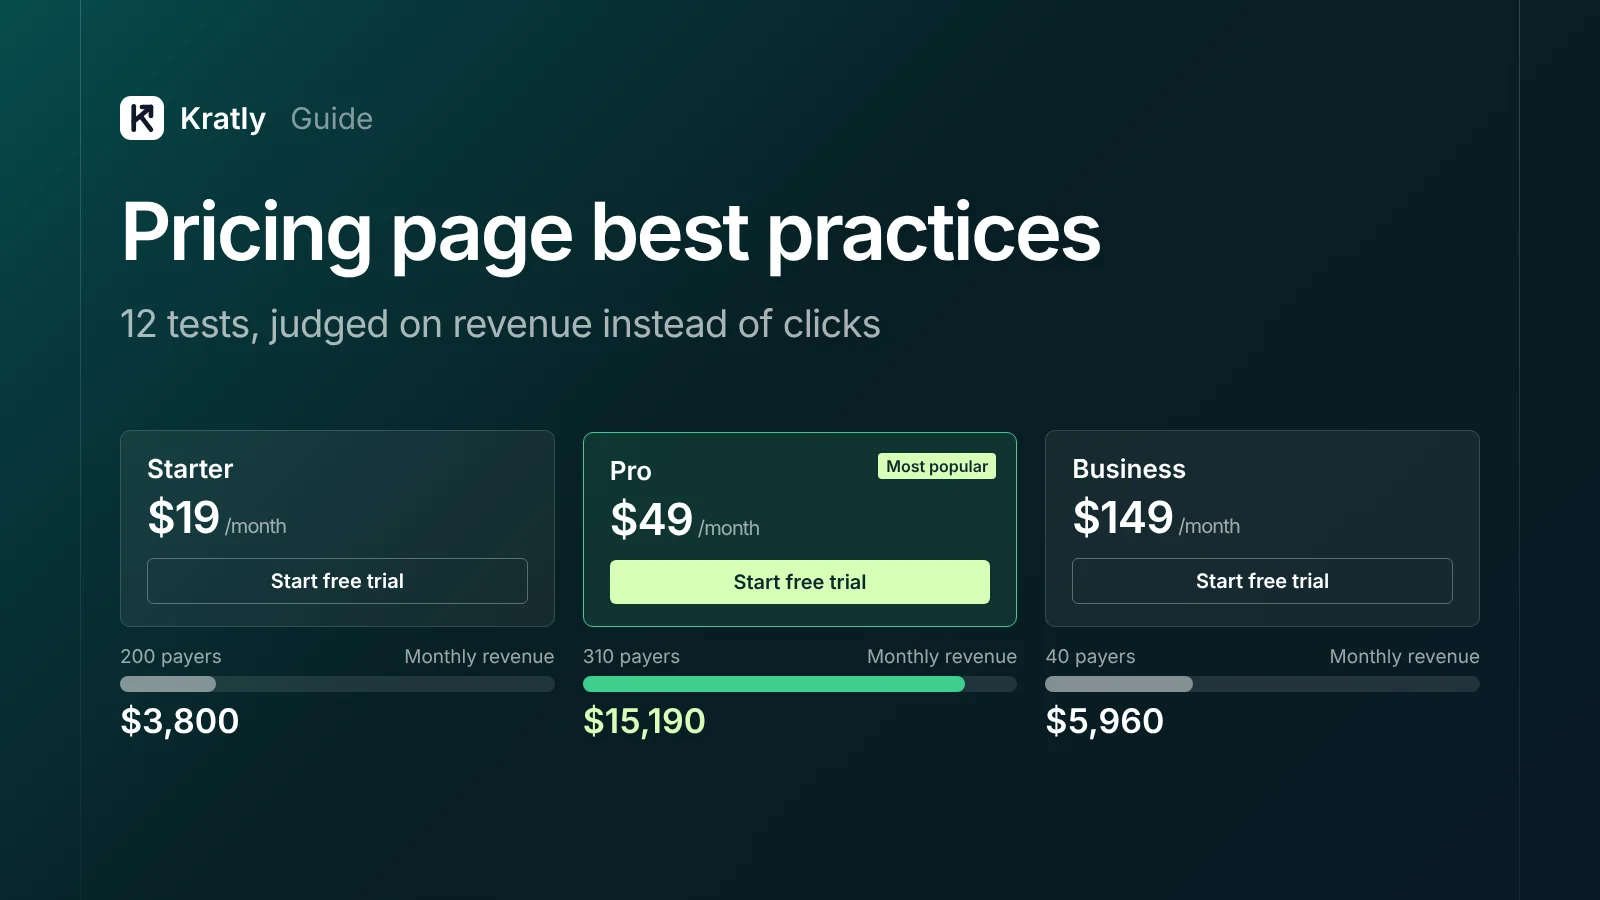
Short answer
The best SaaS pricing page best practices are tests, not rules. Show real prices, keep plans few, say who each plan is for, and put answers to objections next to the button. Then judge every change on paid sign-ups and revenue per visitor in Stripe, not on clicks or trial starts, and wait for enough payers.
Only 4% of G2 product profiles list a price, according to G2's own 2025 audit. Yet 81% of buyers say they want to find pricing on their own (TrustRadius, 2022).
That gap is your opening. Most lists of SaaS pricing page best practices stop at one tip: show your price. This one gives you 12 changes worth testing. For each, you get what the evidence says and how to tell whether the test made you money.
Why judge a pricing page on paid sign-ups#
A pricing page can win on clicks and lose on money. The clearest public example is old but useful.
Server Density, a server monitoring tool, tested per-server pricing against packages starting at $99 a month. Free sign-ups fell from 6.92% to 5.19%. Total revenue rose from $394 to $833, because the average order went from $19.70 to $55.53 (VWO case study).
Judged on sign-ups, they'd have killed the winner. Notice the other lesson too: the test had only 20 and 15 paid upgrades. That's too few to be sure. Revenue doubled, but a few large orders could explain it.
So every test below gets two numbers: paid sign-ups and revenue per visitor. Trial starts are a leading signal, not the verdict.
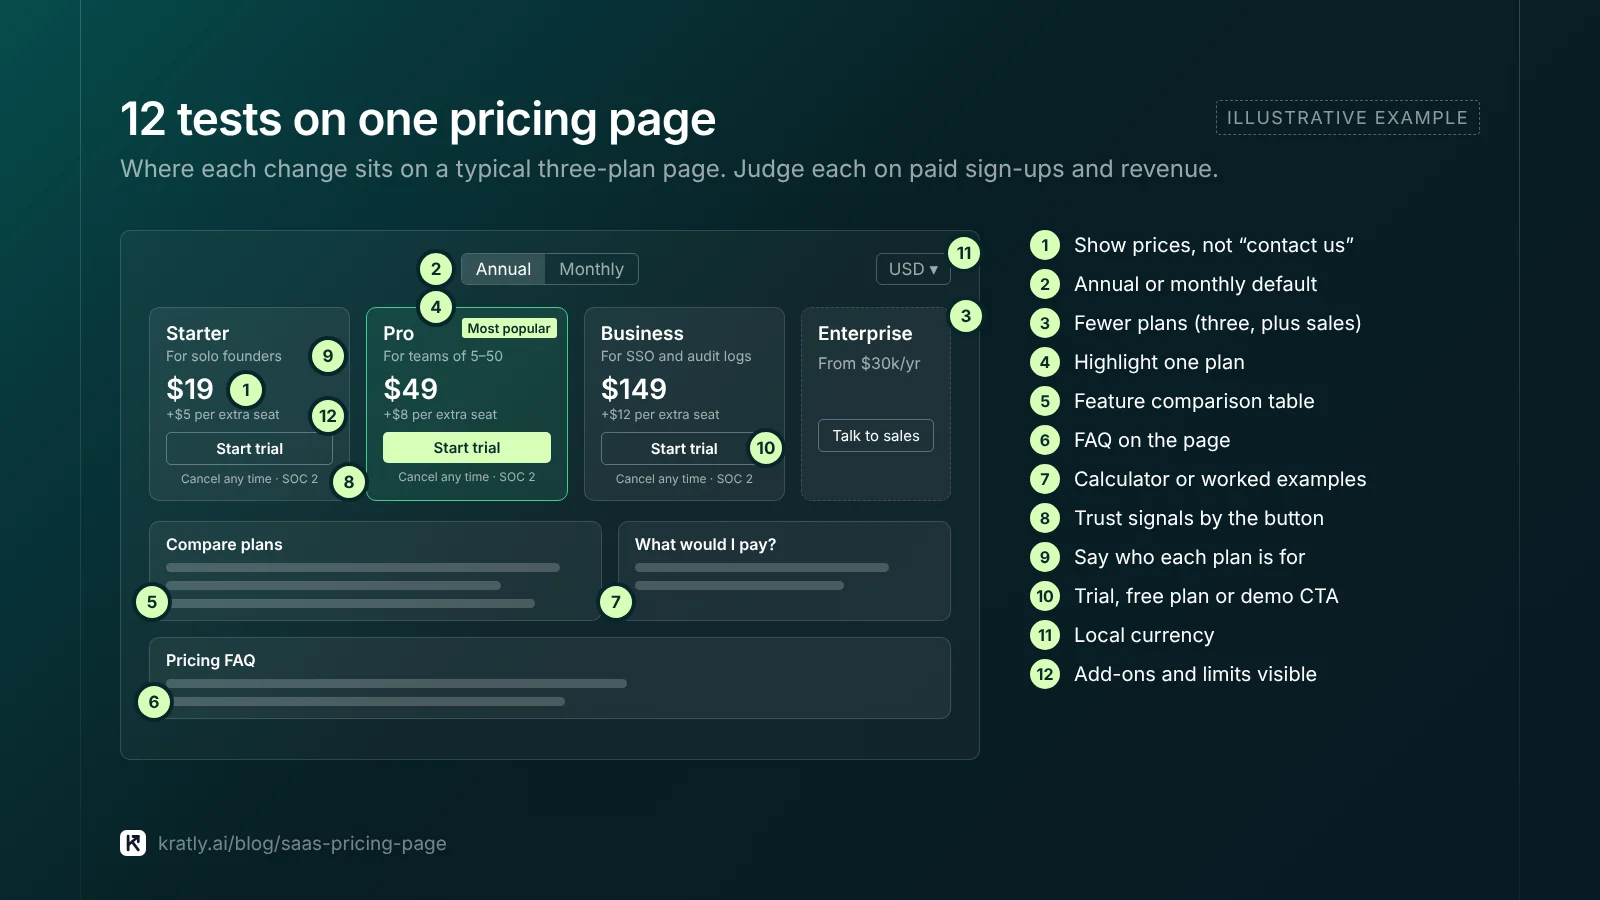
12 SaaS pricing page best practices worth testing#
These are SaaS pricing page best practices as hypotheses. Each has a reason to test it, and a case where I'd skip it.
1. Show prices instead of "contact us"#
Nielsen Norman Group's research found business buyers rank pricing as the information they need most. "We watch participants go to competitors' sites when websites do not show prices," wrote Hoa Loranger (NN/g). In TrustRadius's survey, 71% said visible pricing would make them more likely to buy (TrustRadius).
I'd show prices for every self-serve plan. The opposite case: deals above roughly $30k a year where the price depends on scope. Even then, NN/g suggests a "starting at" price or a typical example.
2. Default the toggle to annual or monthly#
Defaulting to annual shows a lower monthly number and brings cash up front. It can also scare off buyers who want to try a month first. No public study settles this for SaaS.
Test it, and judge on 90-day cash collected and paid sign-ups together. If you're cash-constrained, annual default is worth a small drop in sign-ups.
3. Cut the number of plans#
More plans mean more thinking before paying. Stripe's own embeddable pricing table allows at most four products per billing interval (Stripe Docs). That's a sensible ceiling.
I'd start with three self-serve plans plus a sales-led tier. Go to two if most buyers pick the same plan anyway.
4. Highlight one plan#
A "most popular" badge steers attention. Stripe's pricing table has a setting for it. Highlight the plan you want most people on, not your most expensive one. Then check whether the mix of plans sold moves, and whether total revenue moves with it.
5. Add a feature comparison table#
Cards show the headline. A table below answers "does Pro include SSO?" without a sales call. Keep the cards short and push detail into the table. If your table runs past 30 rows, group it and collapse the rarely used parts.
6. Put an FAQ on the page#
The pricing page is where objections peak: cancel terms, seat changes, refunds, what counts as a "user." Answer them under the plans. This also gives you text that search engines and AI answers can quote.
7. Add a usage calculator, or don't#
For usage-based pricing, a calculator seems kind. NN/g found configurators "complex, time-consuming, and error-prone," used by few people, and suggested representative scenarios instead (NN/g). Stripe's embeddable table doesn't support usage-based pricing at all.
I'd test three worked examples ("a team of 10 sending 50,000 emails pays $X") against a calculator. Keep the calculator only if it wins on paid sign-ups.
8. Put trust signals next to the button#
Security badges, a named customer quote, "cancel any time" and refund terms work best near the click, not in the footer. Use only real logos and real quotes you have permission to show.
9. Say who each plan is for#
Write one line per plan: for solo founders, for teams of 5–50, or for companies that need SSO and audit logs. A line like this saves the buyer from decoding feature lists. It's one of the cheapest tests on this list.
10. Choose the call to action: trial, free plan or demo#
The button decides your funnel. A card-required trial, a no-card trial, a free plan and "book a demo" bring very different people. Compare the models in free trial vs freemium: which brings more paying customers before you test button copy.
If buyers need a demo, you can still show prices. Then send trial users into trial follow-up emails that turn sign-ups into paying customers, because the page only gets them to the door.
11. Show local currency#
Paddle reports that iMobie's conversion rose 23% in France, 20% in Germany and 10% in Japan after localizing prices (Paddle). That's a vendor case study, and it bundled other checkout changes. Stripe's Adaptive Pricing converts prices in 150+ countries, but customers pay a 2–4% conversion fee (Stripe Docs).
I'd test this once more than about 20% of pricing-page visitors come from outside the US.
12. Make add-ons and limits visible#
Extra seats, overage rates and paid onboarding belong on the page. People see companies that hide costs as "evasive and untrustworthy," NN/g warns. A surprise at checkout or on the first invoice costs you refunds and churn later.
Which test to run first: a table#
Start where the change is cheap and the possible effect on paid sign-ups is large.
| Change | Effort | Main risk | Judge on |
|---|---|---|---|
| Show prices | Low | Fewer sales calls | Paid sign-ups, sales-qualified demos |
| "Who it's for" lines | Low | Almost none | Paid sign-ups, plan mix |
| FAQ on page | Low | Page length | Paid sign-ups |
| Highlighted plan | Low | Pushes buyers to the wrong plan | Revenue per visitor |
| Annual default | Low | Fewer monthly sign-ups | 90-day cash, paid sign-ups |
| Fewer plans | Medium | Losing a niche segment | Revenue per visitor |
| Trial vs demo CTA | Medium | Funnel changes downstream | Paid customers after 60–90 days |
| Local currency | Medium | FX fees, tax setup | Paid sign-ups by country |
| Usage calculator | High | Build time, confusion | Paid sign-ups |
What I'd check first: the share of pricing-page visitors who reach checkout. If it's tiny, fix clarity (tests 1, 6, 9) before touching layout.
How to judge a pricing page test with Stripe#
Pricing page conversion to paid is low, so tests need more traffic than most teams expect.
Sample size. At 95% confidence and 80% power, here's roughly how many visitors each version needs (Evan Miller's calculator gives the same ballpark):
| Visitor-to-paid rate now | Lift you want to detect | Visitors per version |
|---|---|---|
| 2% | +20% (to 2.4%) | ~21,000 |
| 3% | +20% (to 3.6%) | ~14,000 |
| 5% | +20% (to 6.0%) | ~8,200 |
| 2% | +50% (to 3.0%) | ~3,800 |
If you get 3,000 pricing-page visitors a month, you can only detect big changes. Test bold ideas, not button colors. Or run a before/after with a holdout, as in how to tell if a marketing change really worked.
Tie the variant to the payment. Pass the test variant and visitor ID into Stripe. The pricing table and Checkout accept a client_reference_id of up to 200 characters (Stripe Docs). Then count paid subscriptions per variant from Stripe, not from your testing tool.
Wait out the trial. With a 14-day trial, a test isn't done when the last visitor enters it. Wait 14 more days, plus time for the first charge.
Watch revenue per visitor, not only rate. Server Density's lesson again: fewer, larger customers can beat more small ones.
Check churn a month later. A cheaper default plan can lift sign-ups and still lose money if those customers leave.
How to do this in Kratly#
We built Kratly so a pricing test ends with a revenue number, not a click number.
- Connect your site and Stripe. Kratly ties pricing-page visits to the subscriptions they turn into.
- Measure each change on revenue. Kratly compares paid sign-ups and revenue from pricing-page visitors before and after a change, against a control.
- See where visitors drop. A funnel from pricing page to checkout to first payment shows which step loses the most.
- Approve and log the change. You approve each change; it's logged and can be reversed.
The pillar guide explains the wider idea: autonomous growth ties every page and campaign to the customers who pay. Your pricing page also needs traffic from people ready to buy, which bottom-of-funnel SaaS SEO pages bring.
Questions, answered
Should a SaaS pricing page show prices?
Yes, for self-serve plans. Buyers rank pricing as the information they need most, and many leave for competitors when it's missing. For large custom deals, show a starting price or a typical example, not a "contact us" button. Only 4% of G2 product profiles list a price, yet 81% of buyers want to find pricing on their own. Showing it sets you apart.
How many pricing tiers should a SaaS have?
Three self-serve plans plus an enterprise or sales tier suits most products. Stripe's embeddable pricing table caps it at four per billing interval. Fewer is better if buyers keep picking the same plan. More plans mean more thinking before paying. Add a "who it's for" line to each plan and highlight the one you want most people on.
What is a good pricing page conversion rate?
There's no reliable public benchmark for pricing-page-to-paid. Track your own visitor-to-paid rate and revenue per visitor, then improve on it. Rates vary heavily with price point, trial model and traffic source. A 2% and a 5% rate can both be healthy for different products. What matters is whether your own rate and revenue per visitor go up after each change.
How long should a pricing page A/B test run?
Until each version has the sample you calculated beforehand, and until your trial length plus first charge has passed. At a 3% visitor-to-paid rate, spotting a 20% lift needs about 14,000 visitors per version. With a 14-day trial, wait 14 more days after the last visitor enters, plus time for the first charge.
Should the annual toggle be the default?
Test it. Annual default brings cash sooner and shows a lower monthly figure, but may cost some monthly sign-ups. Judge it on paid sign-ups and 90-day cash collected together. No public study settles this for SaaS, so your own data decides. If you're cash-constrained, an annual default is worth a small drop in sign-ups.
Written by
Priyansh Kumar
Priyansh Kumar has spent more than a decade in growth, scaling brands from 1 to 10 and from 10 to 100. He now builds Kratly, an autonomous growth team that ties every campaign, page and email to the revenue it brings.
Sources
- G2: Is B2B software pricing transparency broken? (2025)
- TrustRadius: Tech buyers demand honest and up-front pricing info (2022 B2B Buying Disconnect)
- Nielsen Norman Group: State the price to give B2B sites a competitive advantage (Hoa Loranger, 2013)
- VWO / Wingify: How Server Density used VWO to increase revenue
- Paddle: iMobie customer story
- Stripe Docs: Embeddable pricing table · Adaptive Pricing
- Evan Miller: Sample size calculator
Was this article useful?