Short answer
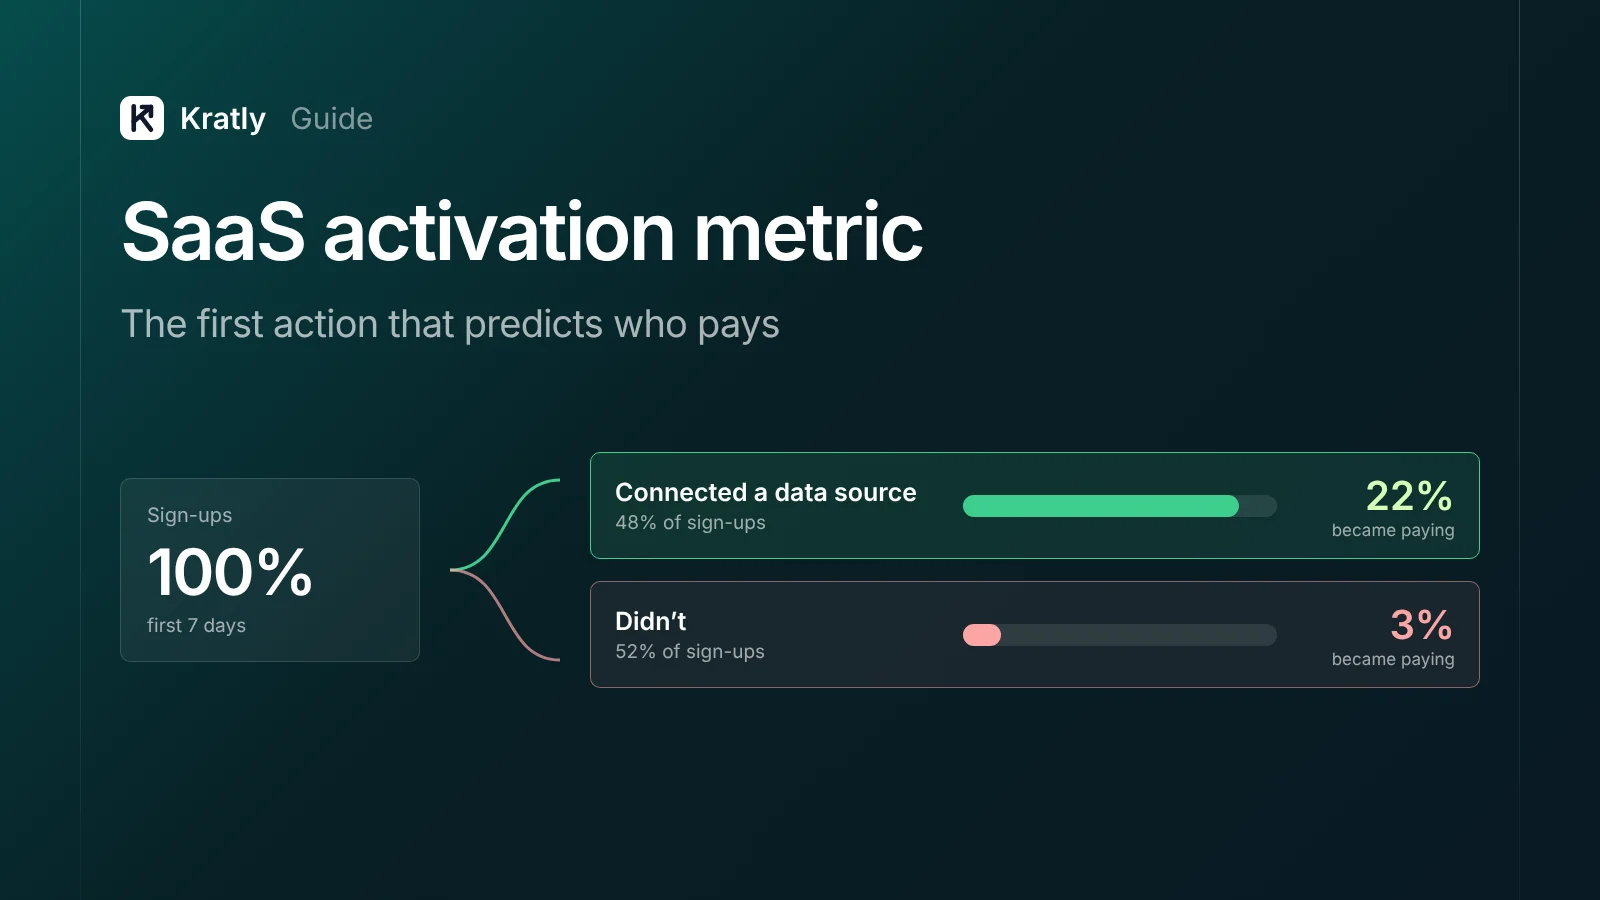
A SaaS activation metric is one early action, with a count and a deadline, that predicts who will pay. To find yours, group past sign-ups by what they did in their first days. Compare how many in each group became paying customers. Pick the action with the biggest gap that many users can reach, then test it.
In June 2026, founder Bill Kiani posted on Indie Hackers: "My Genie 007 trial activation rate is 35%." He added: "That means 65% of people who sign up for a free trial never actually use the product" (Indie Hackers).
Most SaaS teams know that feeling. Ads and SEO bring sign-ups. Then most sign-ups vanish before they see what the product does. A clear SaaS activation metric tells you who is on track to pay, while there's still time to help the rest.
What a SaaS activation metric is#
Lenny Rachitsky gives a clear definition of the activation milestone. It's "the earliest point in your onboarding flow that, by showing your product's value, is predictive of long-term retention" (Lenny's Newsletter). Activation rate is the share of sign-ups who reach it.
A good one has three parts:
- An action that delivers value, such as "sent a first invoice," not "clicked around the dashboard."
- A threshold, such as one invoice or three.
- A time window, such as within 7 days of sign-up.
The "aha moment" is the feeling. The activation metric is the event you can count.
What I'd change in most definitions: for a paid SaaS, predict payment, not just retention. Retention is a fine proxy for free products. But a business that sells subscriptions should check its milestone against Stripe. A user can come back every day on a free plan and never pay.
What it isn't: "completed onboarding" or "finished the product tour." Those measure your flow, not the customer's result. People can click through a tour and learn nothing.
Famous aha moments, and why not to copy them#
You'll see a few examples repeated in almost every article on this topic.
- Facebook, "7 friends in 10 days." Attributed to Chamath Palihapitiya, who led Facebook's growth team. The best-known write-up is a 2012 recap of a growth panel by Academia.edu founder Richard Price (Richard Price, summarized by Inside).
- Dropbox, "one file in one folder on one device." From the same panel recap, attributed to Dropbox's growth lead at the time.
- Slack, "2,000 messages." This one is everywhere. We couldn't find a primary source from Slack, so treat it as folklore until you see one.
These are second-hand accounts of talks from more than a decade ago. They're widely repeated, rarely sourced.
Lenny's survey gives more useful, everyday examples: "First day of food and weight logged," "First 5 survey responses collected," "First job application sent." For team products: "workspace with 10 items created and 2+ active editors by W4" (Lenny's Newsletter).
The point of the famous ones isn't the number. It's the shape: one action, a count, a deadline. Your number has to come from your own data.
How to find your activation metric in five steps#
You need about three months of sign-ups, product events, and payment data from Stripe or your billing tool. A spreadsheet works.
Step 1: Define the outcome. Pick "became a paying customer within 60 days of sign-up," or your trial length plus a month. Pull it from billing, not from a "plan selected" event.
Step 2: List early actions. Write down 10 to 20 actions a new user can take in their first week. Amplitude's Compass chart uses a 7-day first-use window by default (Amplitude). Use your trial length if it's shorter.
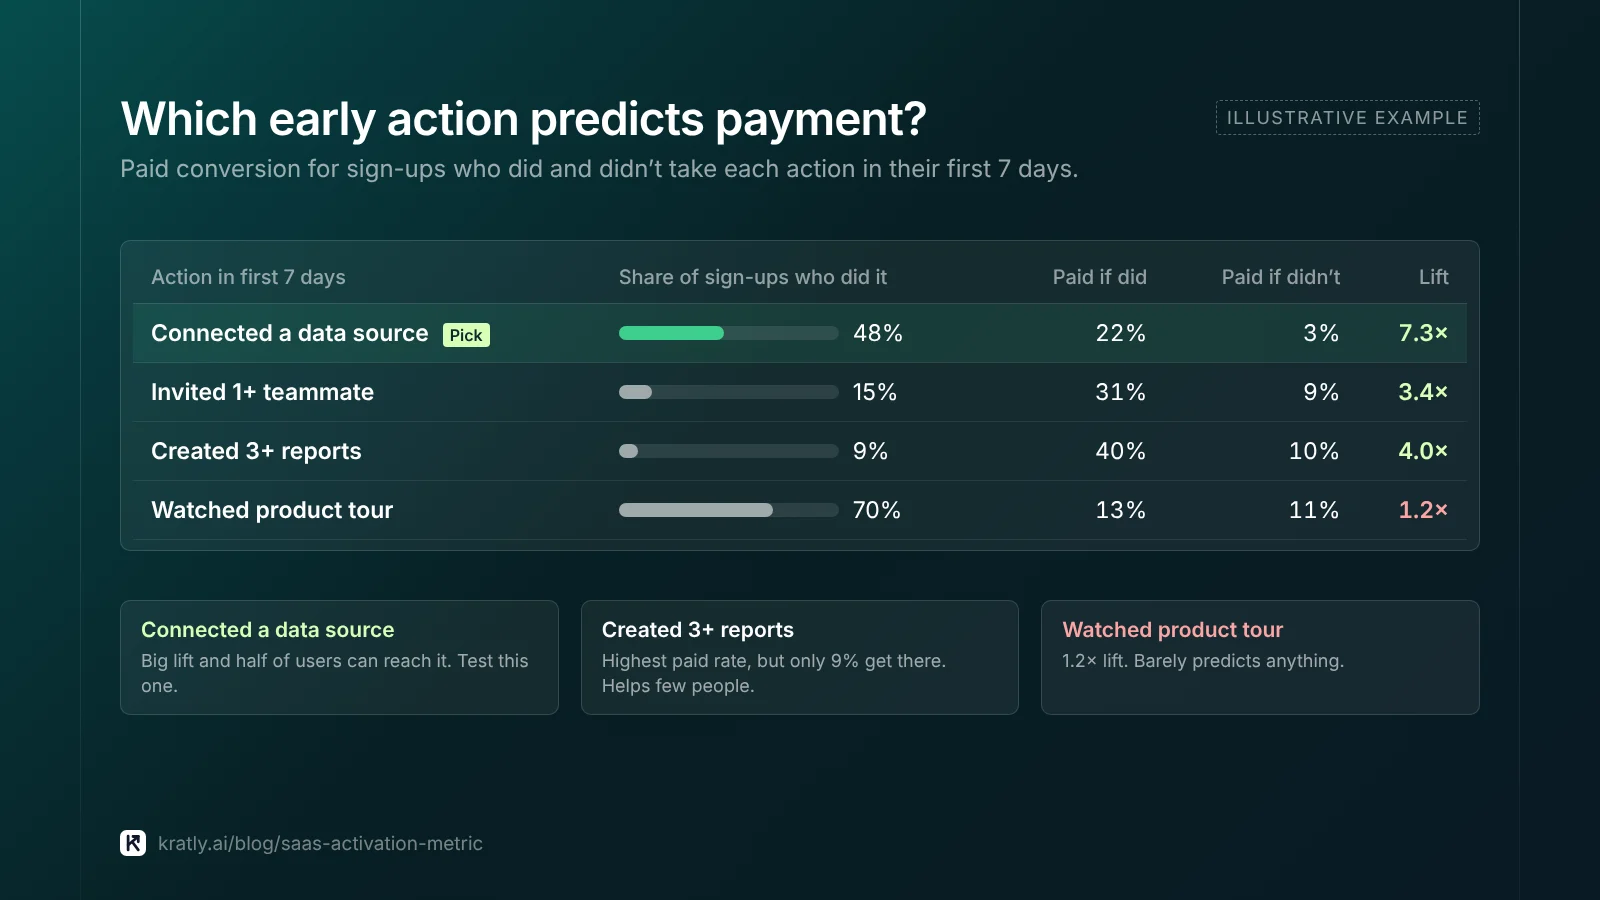
Step 3: Build the cohort table. For each action and threshold, compare paid conversion for users who did it and users who didn't. Here's an illustration with made-up numbers:
| Action in first 7 days | Share of sign-ups who did it | Paid if did | Paid if didn't | Lift |
|---|---|---|---|---|
| Connected a data source | 48% | 22% | 3% | 7.3× |
| Invited 1+ teammate | 15% | 31% | 9% | 3.4× |
| Created 3+ reports | 9% | 40% | 10% | 4.0× |
| Watched product tour | 70% | 13% | 11% | 1.2× |
Here, "connected a data source" wins. The lift is large and half your users can reach it. "Created 3+ reports" has a higher paid rate, but only 9% get there, so pushing it helps fewer people. The tour barely predicts anything.
Lenny suggests a good milestone should retain users at least 2× better than those who miss it (Lenny's Newsletter). Amplitude labels a correlation of 0.4 or higher as "highly predictive" (Amplitude).
Step 4: Check it isn't a disguise. Amplitude's own docs warn: "Correlation and causation aren't the same thing." A high score can reflect a third factor. What I'd check first: does the action just mark bigger companies, sales-assisted deals, or one traffic source? Split the table by plan size and by channel. If the lift vanishes inside each group, you found a filter, not a lever.
Step 5: Test it. Change onboarding for half of new sign-ups so more of them reach the action. Keep the other half as a holdout. Compare paid conversion, not activation rate. If paid conversion rises, keep it. Did your change really work? covers how to read a test like this.
Trade-off in hours. A first pass in a spreadsheet takes a day or two of analyst time. A real onboarding test needs a few weeks of sign-ups to reach a readable result. I'd still do the test. Teams that skip it often spend a quarter pushing users toward an action that only marked good customers.
Activation rate benchmark: what's good?#
The most-cited public benchmark is Lenny Rachitsky's 2022 survey of over 500 responses (Lenny's Newsletter):
| Group | Average activation rate | Median |
|---|---|---|
| All products | 34% | 25% |
| SaaS only | 36% | 30% |
Lenny calls the 60th percentile good and the 80th great. Bill Kiani's 35% sits right around the SaaS average.
For the next step, from sign-up to paid:
- Free-to-paid: median 8% across 200 B2B products, about 30% when a card is required up front (Growth Unhinged and ChartMogul, Feb 2026) (Growth Unhinged).
- Trial-to-paid: 17.3% for opt-in trials and 49.1% for opt-out trials, in agency client data from 86 SaaS companies (First Page Sage).
Use benchmarks lightly. Everyone defines activation differently, so a 25% rate on a hard milestone can beat 60% on an easy one. The benchmark that matters is your own rate last quarter. If you changed your definition, reset the baseline.
Onboarding metrics to track around it#
One number isn't enough. These five onboarding metrics tell you where activation breaks:
| Metric | What it tells you | What I'd do when it drops |
|---|---|---|
| Activation rate | Share of sign-ups who reach the milestone | Look at the step before it in onboarding |
| Time to activate | Median hours or days from sign-up | Remove setup steps; offer a template or sample data |
| Activated → paid | Whether the milestone still predicts payment | Re-run the cohort table; your product may have changed |
| Activation rate by campaign | Which ads and pages bring users who get value | Shift budget toward sources with high activation |
| Not activated by day 3 | Users who need help now | Trigger a targeted email or a check-in |
Activation by campaign is the one most teams miss. Two campaigns can bring the same number of sign-ups at the same cost. If one activates at 50% and the other at 15%, they're not the same campaign. This is the gap we built Kratly around: connecting ad spend, product behavior and revenue in one place. Autonomous growth explains why connecting tools alone doesn't close it.
Emails. Your activation metric should drive your trial emails. Send the "how to connect your data" email to people who haven't, not to everyone on day 2. See trial follow-up emails that turn sign-ups into paying customers.
Cancellations. Add "I never got it set up" as a reason in your cancellation survey. If it's a top answer, your churn problem is an activation problem. Your SaaS cancellation flow is where you'll hear it first.
How to do this in Kratly#
- Connect your ad accounts, website and Stripe. Kratly ties each sign-up to the campaign and page it came from, and to whether it paid.
- Compare campaigns by cost per paying customer. Spot campaigns with cheap sign-ups that rarely pay.
- Add your activation event. Kratly flags campaigns and pages whose sign-ups activate less often than your average.
- Approve suggested changes. Budget shifts and email triggers are suggested; you approve them, and each change is logged and reversible.
Questions, answered
What is a good SaaS activation metric?
A good SaaS activation metric is one action that delivers real value, with a count and a time window. An example is "connected a data source within 7 days." Users who reach it should pay at least twice as often as users who don't. A large share of users should also be able to reach it, or pushing it helps few people.
What is the difference between an aha moment and an activation metric?
The aha moment is when the user feels the product's value. The activation metric is the countable event that marks it. An example is "sent first invoice within 3 days." You can track and test the metric. You can only infer the feeling.
What is a good activation rate for SaaS?
Around 36% is average. In Lenny Rachitsky's 2022 survey of over 500 responses, SaaS products averaged 36% with a median of 30%. Lenny calls the 60th percentile good and the 80th great. Definitions vary a lot, so a 25% rate on a hard milestone can beat 60% on an easy one. Compare against your own past rate first.
How often should I revisit my activation metric?
About twice a year, and whenever your product, pricing or main traffic source changes. Re-run the cohort table and check that activated users still pay at a much higher rate, ideally at least twice as often. If the gap shrinks, your product may have changed. Pick a new action, test it, and reset your baseline.
Written by
Priyansh Kumar
Priyansh Kumar has spent more than a decade in growth, scaling brands from 1 to 10 and from 10 to 100. He now builds Kratly, an autonomous growth team that ties every campaign, page and email to the revenue it brings.
Sources
- Lenny's Newsletter: What is a good activation rate (Oct 2022)
- Amplitude docs: Compass chart and aha moments · Interpret your Compass chart
- Indie Hackers: Bill Kiani, trial activation rate is 35% (June 2026)
- Growth Unhinged and ChartMogul: Free-to-paid conversion report (Feb 2026)
- First Page Sage: SaaS free trial conversion benchmarks (Oct 2026)
- Richard Price: Growth hacking: leading indicators of engaged users (2012) · Inside: Chinese-language summary
Was this article useful?