Short answer
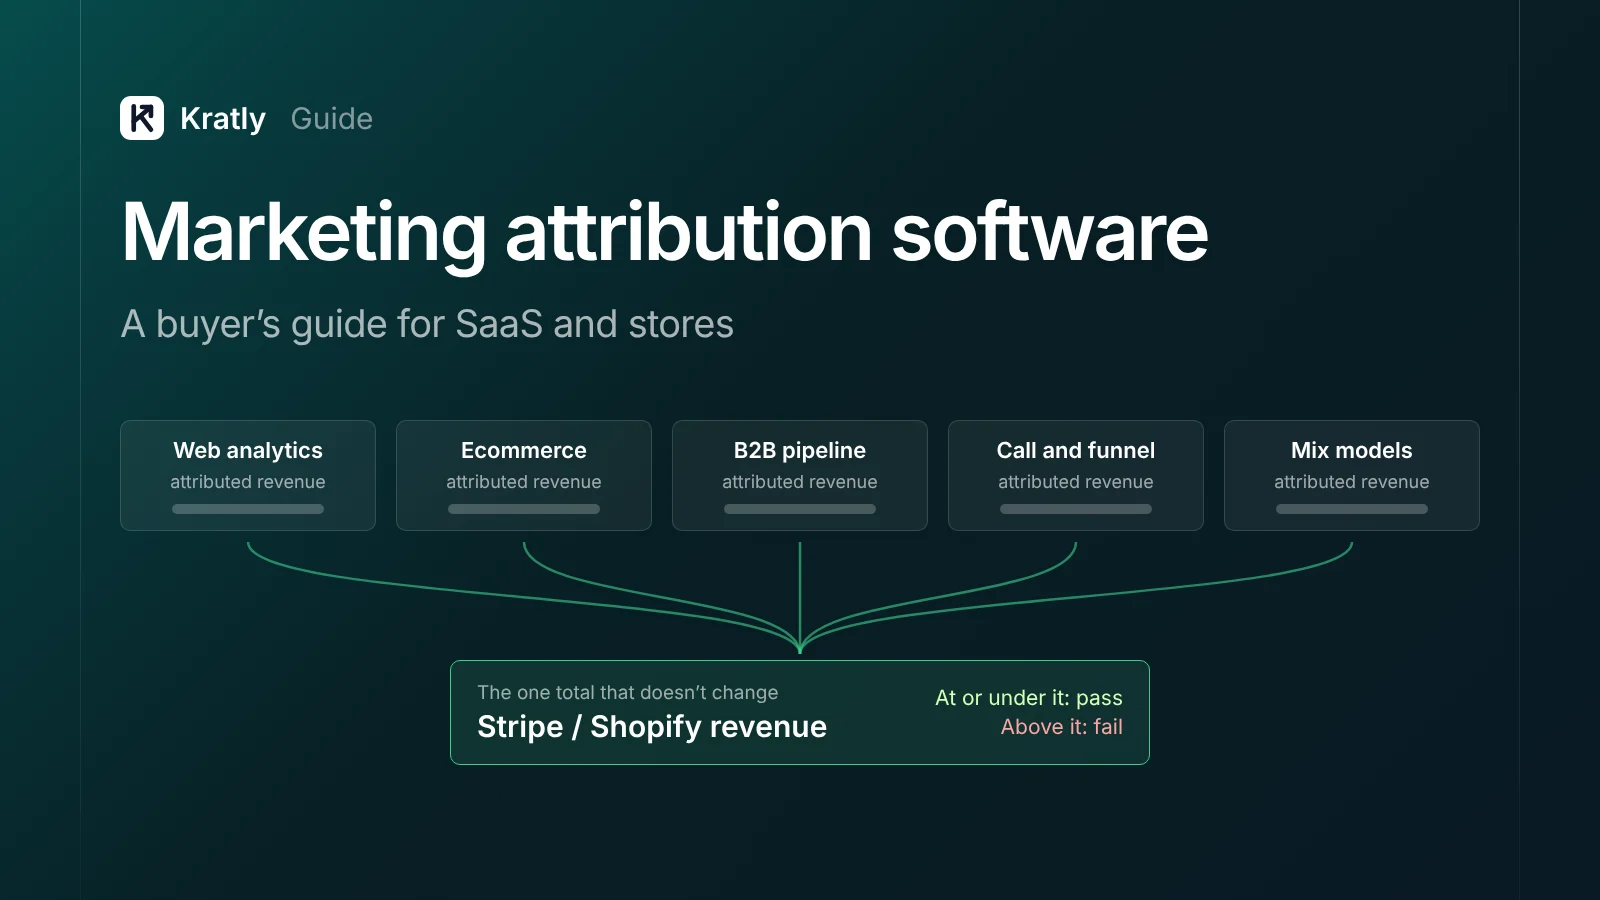
Marketing attribution software ties sales back to the ads, pages and emails that drove them. Pick the type by where your revenue lives: Stripe, Shopify or a CRM. Check that it uses server-side tracking and sends revenue back to ad platforms. Then trial it for two weeks against your real revenue.
A Shopify store owner posted this on the Shopify Community forum: "Facebook is reporting more than double the sales that Shopify reports."
That gap is why people shop for marketing attribution software. The catch is that the tools you trial will disagree with each other too. This guide helps you pick the type that fits, ask the right questions and judge every tool against one number: the revenue in your payment system.
A note on bias: Kratly sells in this category. I've named each tool's strengths and linked every price claim so you can check it.
What is marketing attribution software?#
Marketing attribution software is a tool that links each sale or lead to the marketing touches before it, so you can see which spend brings revenue.
Revenue attribution software narrows that to money received, not clicks or sign-ups. Multi touch attribution software splits credit across several touches instead of giving it all to one.
Why buy anything? Because the free defaults are thin. GA4 removed its rule-based models in November 2023 (Google Analytics Help). Google Ads now offers only data-driven and last click (Google Ads Help). And only 21.5% of US marketers said last click reflects long-term impact accurately (eMarketer).
The models themselves are covered in last non-direct click vs first touch. This guide is about the software.
The five types of attribution software#
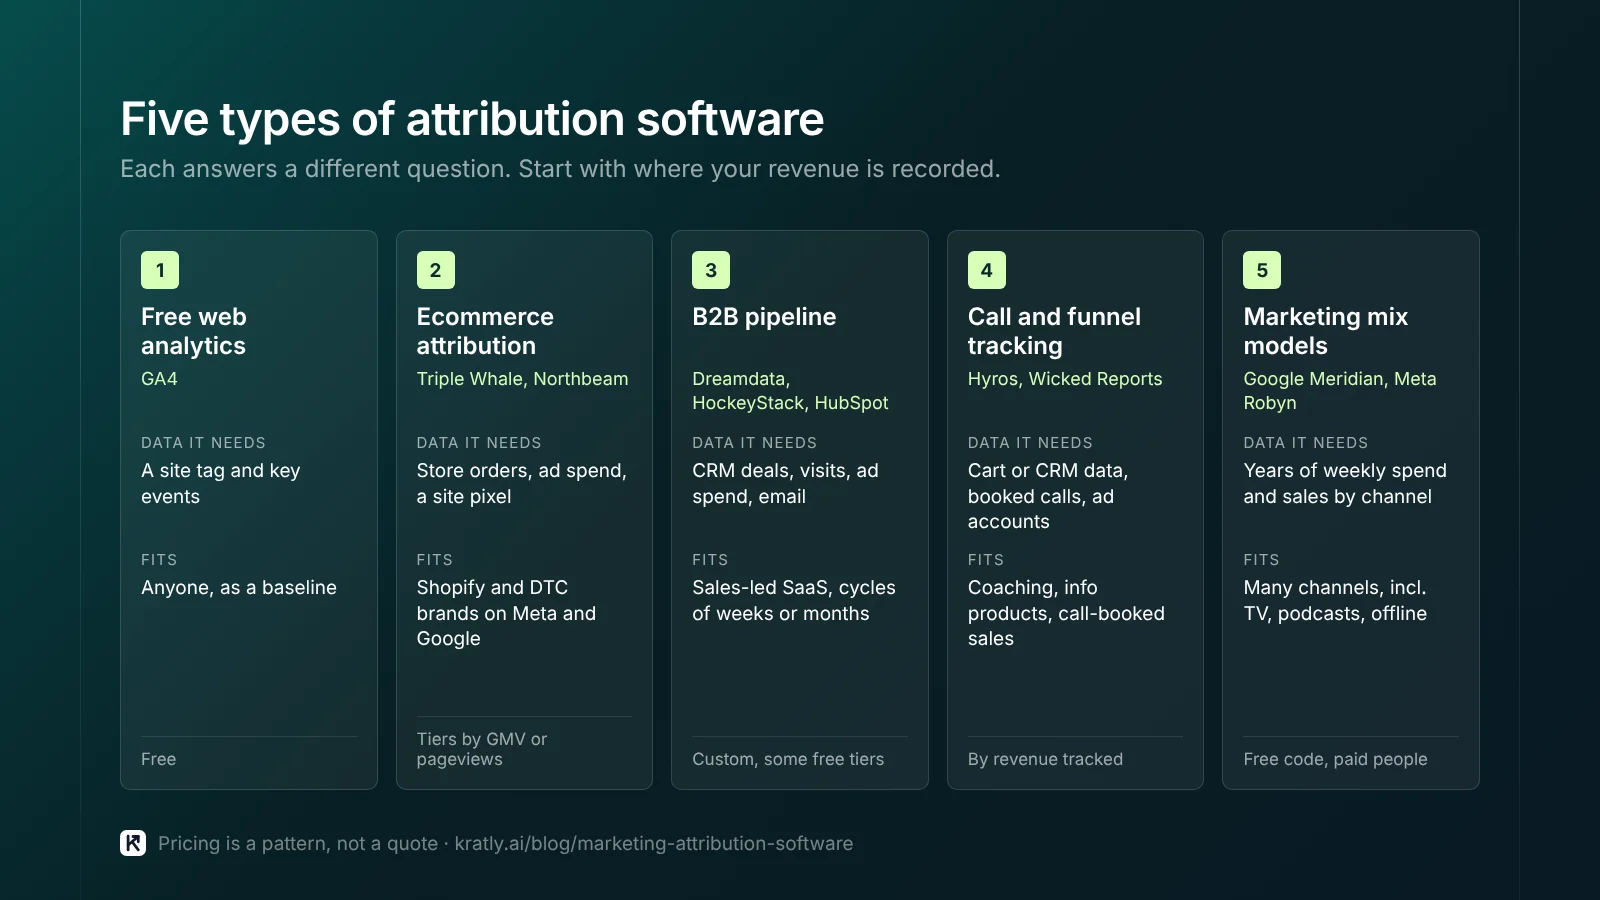
1. Free web analytics (GA4)#
Fits: anyone, as a baseline. Data it needs: a site tag and key events. Pricing: the standard version is free.
GA4's strength is reach. It sees every session and links natively to Google Ads. Its weakness is money: it often misses payments made in your app or on Stripe's page. Treat it as directional. Paid and free options that track revenue better are in Google Analytics alternatives for SaaS that track revenue.
2. Ecommerce attribution (Triple Whale, Northbeam)#
Fits: Shopify and DTC brands spending mostly on Meta and Google. Data it needs: store orders, ad spend and a site pixel.
Triple Whale is built around Shopify. It has a free plan, and paid tiers scale with GMV over the last 12 months. Multi-touch models start on paid plans. MMM and geo incrementality tests sit in higher tiers or its Compass add-on (Triple Whale Help).
Northbeam aims at larger spenders. It prices by data volume, measured in pageviews. Incrementality and MMM are add-ons on higher plans. A head-to-head is in Triple Whale vs Northbeam vs Hyros: attribution tools compared.
3. B2B and pipeline attribution (Dreamdata, HockeyStack, HubSpot)#
Fits: sales-led SaaS with a CRM and cycles of weeks or months. Data it needs: CRM deals, website visits, ad spend and email.
Dreamdata has a free tier with B2B web analytics. Attribution sits in its custom-priced Advanced plan. HockeyStack joins marketing, sales and revenue data. Its pricing is custom, with startup pricing offered.
HubSpot's strength is that the data already lives there. But its revenue and deal create attribution reports need Marketing Hub Enterprise (HubSpot Knowledge Base).
4. Ad tracking for calls and funnels (Hyros, Wicked Reports)#
Fits: coaching, info products, call-booked sales and subscription brands. Data it needs: cart or CRM data, booked calls and ad accounts.
Hyros is built for ad tracking in these businesses, including booked calls and closed deals. Pricing is quoted on a call and follows the revenue it tracks.
Wicked Reports is strong on cohorts and lifetime value. Its Measure plan lists $499 a month for the $0 to $2.5M revenue band.
5. Marketing mix models (Google Meridian, Meta Robyn)#
Fits: brands spending across many channels, including TV, podcasts and offline. Data it needs: years of weekly spend and sales by channel. Meridian's docs call two years of national weekly data thin; three years, or data by region, works better (Google Meridian).
Google opened Meridian to everyone on January 29, 2025 (Google). It's open source and can take incrementality test results as inputs. Robyn is Meta Marketing Science's open source MMM, written in R. Both are free to download. The cost is a data scientist's time.
Which type fits? A comparison table#
| Type | Best for | Revenue source | Cookie-free method | Typical pricing model |
|---|---|---|---|---|
| Free web analytics | Baseline for all | Tags on your site | No | Free |
| Ecommerce attribution | Shopify and DTC | Store orders | Usually server-side pixel | Tiers by GMV or pageviews |
| B2B pipeline | Sales-led SaaS | CRM deals | CRM matching | Custom, some free tiers |
| Call and funnel tracking | Calls, courses, offers | Cart or CRM | Varies; ask | By revenue tracked |
| Marketing mix model | Many channels incl. offline | Aggregate weekly sales | Not user-level at all | Free code, paid people |
The pricing column is a pattern, not a quote. Check each vendor's page.
The 8 questions that decide fit#
- Where does your revenue live? Stripe, Shopify or a CRM. The tool must read that system directly. If it only reads its own pixel, it reports pixel revenue, not your revenue.
- How long is your sales cycle? A 2-day checkout and a 90-day B2B deal need different tools. Ask how long the tool keeps a click before it expires.
- Which channels do you run? List them, including ones nobody clicks, like podcasts. Ask how each is measured.
- Does it track server-side? Safari caps script-set cookies at 7 days (WebKit). Server-side capture survives longer.
- Does it send revenue back to ad platforms? Bidding learns from what you send. Look for Google Ads offline conversions and the Meta Conversions API.
- Does it support incrementality? Attribution shows who touched what. It doesn't prove cause. See how to run a marketing incrementality test.
- Can you export your data? Ask for raw, row-level exports or a warehouse sync. If you leave, your history should leave with you.
- What's the total cost? Add setup hours, engineering time, onboarding fees and the contract term. A $500 tool that needs 40 engineering hours costs far more.
Red flags in an attribution demo#
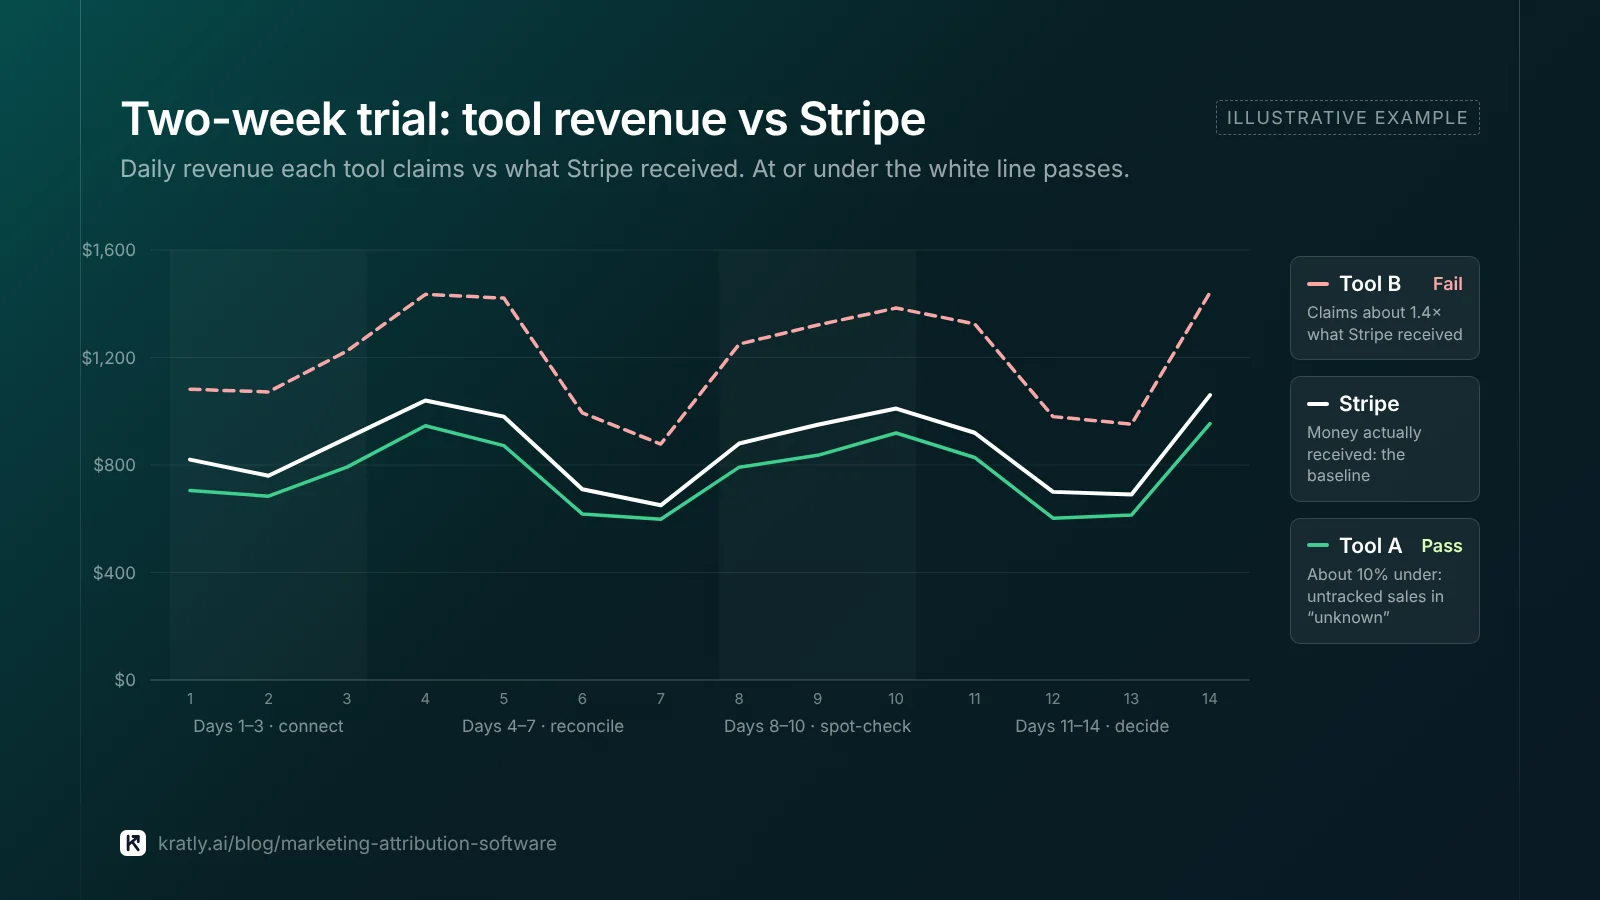
- Their total beats your payment system. If attributed revenue is higher than Stripe or Shopify, they're double counting.
- No "unknown" bucket. Every honest setup has untracked sales. A demo with none is hiding them.
- "Our model is proprietary" with no detail. You don't need the code. You do need to know what data it uses and how it handles views.
- Demo data only. Ask to see your own account, even a 7-day backfill.
- Annual contract before a trial. Ask for a paid pilot or a short exit clause.
- Refunds ignored. Ask how refunds and churn reduce attributed revenue.
- ROAS lift promised before setup. Nobody knows your lift until your data is in.
How to run a 2-week trial#
Judge it on your revenue, not its dashboard.
Days 1–3: connect and backfill. Connect ad accounts, the site and Stripe or Shopify. Write down the setup hours.
Days 4–7: reconcile. For each day, compare the tool's total revenue with Stripe or Shopify. A small gap is normal. A tool that claims more than you earned is a problem.
Days 8–10: spot-check customers. Pick 20 recent buyers. Does the tool's source match what they said in "How did you hear about us?"
Days 11–14: make one decision. Use the tool to change one budget. If it can't support a single real decision, it won't support fifty.
| Trial check | Pass | Fail |
|---|---|---|
| Attributed revenue vs Stripe/Shopify | At or below the real total | Above it |
| Unknown share | Shown and explained | Hidden |
| 20-buyer spot check | Most match self-reported | Mostly "direct" |
| Revenue sent to ad platforms | Verified in Google Ads and Meta | Not set up |
| Setup time | Logged and acceptable | Unknown or growing |
Do you need attribution software yet?#
Maybe not. If you spend under about $10k a month, run two or three channels and make few sales, a spreadsheet is enough. That's our judgment, not a standard.
The method is in SaaS marketing attribution: tie every campaign to real revenue. Capture UTMs and click IDs, store first and last touch on the user, pass them into Stripe and report revenue by campaign.
Buy software when one of these is true: the spreadsheet takes more than a few hours a week, you run four or more channels, or you need revenue sent back to the ad platforms daily.
How to do this in Kratly#
Kratly fits SaaS on Stripe and stores on Shopify that run Google Ads and Meta Ads. It isn't an MMM, and it isn't the pick if your revenue lives only in a CRM.
- Connect Google Ads, Meta Ads, your site and Stripe or Shopify. Kratly ties each payment to the campaign, page or email that brought it.
- Reconcile on day one. Compare revenue by campaign with your Stripe or Shopify total.
- Review suggestions. Kratly suggests budget changes. You approve them, and each change is logged and reversible.
- Use the same trial plan above. Judge Kratly the way you'd judge any other tool.
LinkedIn, TikTok and Reddit Ads are coming soon. Until then, tag that traffic with UTMs and upload its spend as a CSV.
Questions, answered
What is the best marketing attribution software?
There's no single best tool. Shopify brands often start with ecommerce attribution such as Triple Whale. Sales-led SaaS usually needs pipeline tools such as Dreamdata or HubSpot. Multi-channel brands with offline spend may add an MMM like Meridian. Pick by where your revenue lives, then trial against Stripe or Shopify.
How much does attribution software cost?
It ranges from free to thousands of dollars a month. GA4, Meridian and Robyn are free, but MMMs need data science time. Paid tools usually price by revenue, GMV or pageviews. Wicked Reports lists $499 a month for its smallest band. Add setup hours and contract length to compare fairly.
Is multi touch attribution software worth it?
Only once your basics work. You need click IDs captured, sources stored on each customer and revenue joined from Stripe or Shopify. Without that, multi-touch spreads credit over missing data. It earns its cost when you run several channels and buyers take weeks to decide.
Why do attribution tools show different numbers?
Each tool uses its own model, click window and data source. Ad platforms count their own conversions, and two can claim the same sale. Some count views, others only clicks. Your payment system is the one total that doesn't change, so judge every tool against it.
Written by
Priyansh Kumar
Priyansh Kumar has spent more than a decade in growth, scaling brands from 1 to 10 and from 10 to 100. He now builds Kratly, an autonomous growth team that ties every campaign, page and email to the revenue it brings.
Sources
- Shopify Community: Facebook reporting double the sales that Shopify reports (Mar 2021)
- Google Analytics Help: Retired attribution models · Google Ads Help: About attribution models
- eMarketer: Just 1 in 5 marketers confident in last-click attribution (2024)
- Google: Meridian is now available to everyone (Jan 29, 2025) · Meridian: amount of data needed · Meta Marketing Science: Robyn on GitHub
- WebKit: Intelligent Tracking Prevention 2.1
- HubSpot Knowledge Base: Understand attribution reporting
- Vendor pricing pages: Triple Whale · Triple Whale plans · Northbeam · Dreamdata · HockeyStack · Hyros · Wicked Reports
Was this article useful?